

KPI yazılımları, temel performans göstergelerini izleyip görselleştirmenize ve yönetmenize yardımcı olur; böylece işletme hedeflerinize doğru ilerlemeyi ölçebilirsiniz. En iyi KPI yazılımını arıyorsanız muhtemelen metrikleri izlemek, içgörüleri paylaşmak ve ekibiniz ya da kuruluşunuz genelinde veriye dayalı kararları desteklemek için güvenilir araçlara ihtiyacınız vardır.
Bu kadar çok seçenek mevcutken raporlama ihtiyaçlarınıza uyan, mevcut sistemlerinizle entegre olan ve öncelikleriniz değiştikçe uyum sağlayan bir yazılım bulmanız çok önemlidir. Bu kılavuz, 2026 için en iyi KPI yazılımlarını karşılaştırmanıza yardımcı olacak ve performans yönetimi stratejinizi destekleyecek doğru çözümü seçmenizi sağlayacaktır.
Why Trust Our Software Recommendations
6,700+
Reviews
20
Industry experts
16+
Evaluation factors
14
Years
Our team has been testing and reviewing software since 2012. As HR experts ourselves, we know how difficult—and important—it is to choose the right software.
For this guide, we evaluated tools using hands-on testing and independent research, scoring tools using our selection criteria. We also draw on insights from industry thought leaders and practicing HR experts.
Our reviews reflect our human editorial judgment, not a sales pitch.
Expert reviewers:
- Phil GrayCOO
 Kim BehnkeHR Tech Editor & Analyst
 Josh BarkerPeople Ops Manager

KPI Yazılımları Karşılaştırma Tablosu
Bu karşılaştırma tablosu, en iyi KPI yazılımı seçimlerimin fiyatlandırma ayrıntılarını özetlemektedir:
Sorted by: Default
| Tool | Starting Price | Website | |
|---|---|---|---|
Best as an AI for business | 4.4 out of 5 | $8/user/month Free trial + Free demo available | Website |
Best for auto-generating auditable KPI reports | 5.0 out of 5 | $29/month Free plan available | Website |
Best for custom dashboard creation | 4.7 out of 5 | $120/month 14-day free trial | Website |
Best for strategic goal alignment | 4.8 out of 5 | Pricing upon request Free trial + free demo available | Website |
Best for advanced data visualization | 4.5 out of 5 | Pricing upon request 14-day free trial | Website |
Best for financial metric visualization | 4.6 out of 5 | $15/month 7-day free trial + free demo available | Website |
Best for marketing analytics integration | 4.4 out of 5 | $20/user/month Free plan + 14-day free trial + demo available | Website |
Best for mobile performance monitoring | 4.5 out of 5 | $71/month Free plan + 14-day free trial + free demo available | Website |
Best for enterprise data connectivity | 4.4 out of 5 | Pricing upon request 30-day free trial | Website |
Best for integrated business management | 4.5 out of 5 | $19.99/month 14-day free trial | Website |


En İyi KPI Yazılımı İncelemeleri
Aşağıda kısa listeme giren en iyi KPI yazılımlarının ayrıntılı özetlerini bulabilirsiniz. İncelemelerim, size en uygun seçeneği bulmanıza yardımcı olmak için her yazılımın özelliklerini, en uygun kullanım alanlarını ve entegrasyonlarını ayrıntılı olarak ele almaktadır.
 Best as an AI for business
- Free trial + Free demo available
- From $8/user/month
Visit WebsiteCustomer Rating:4.4/5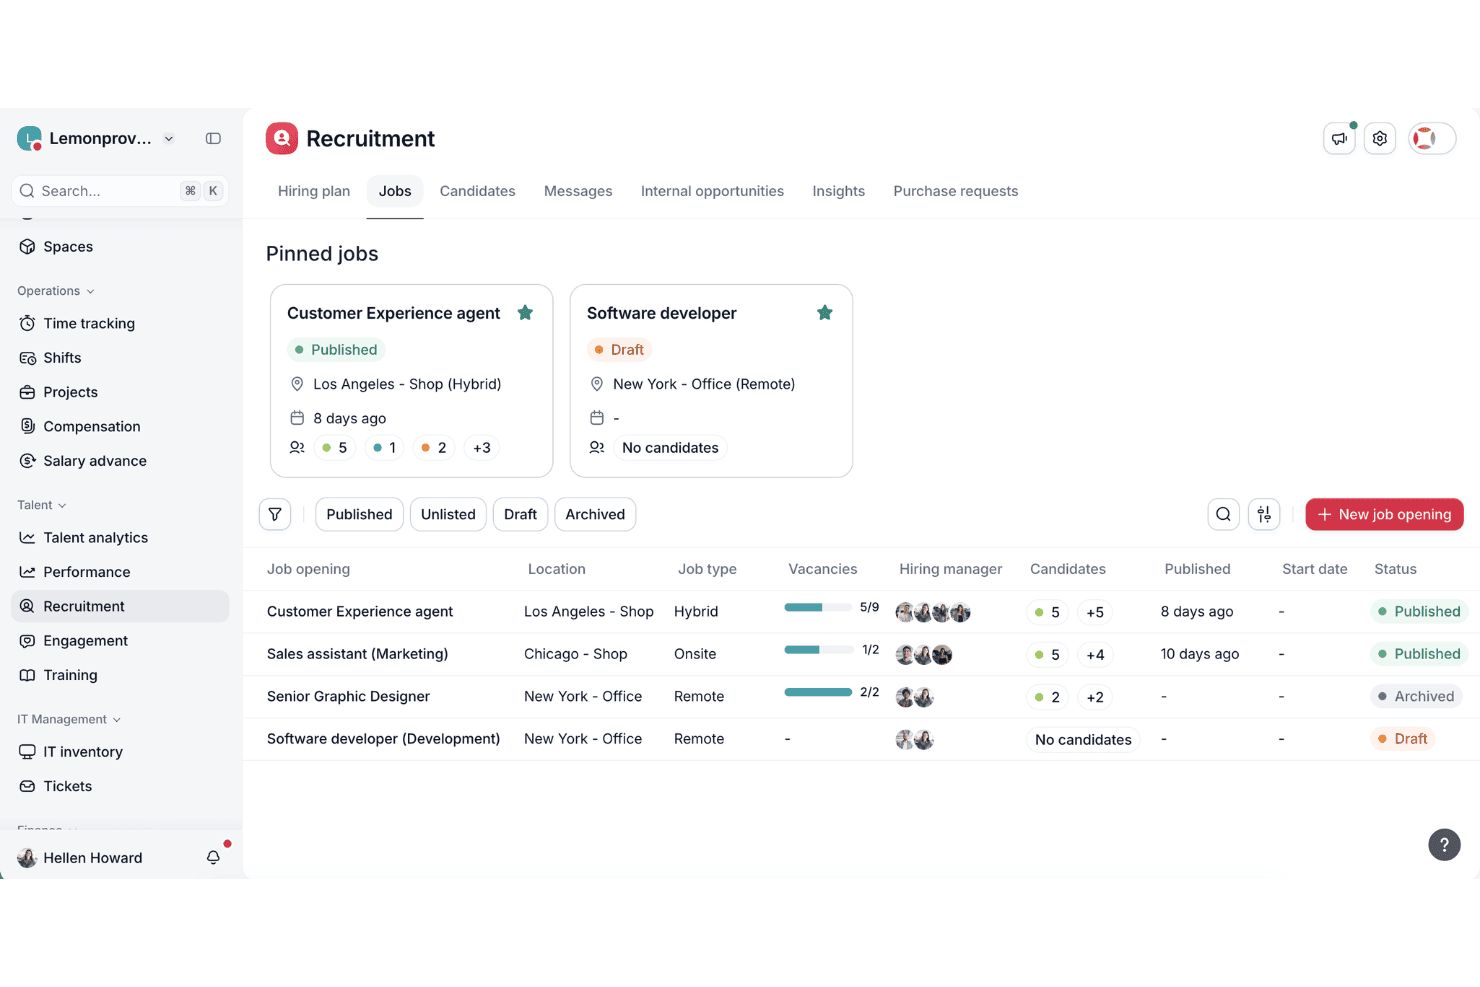
Factorial centralizes recruitment with job listings, candidates, and status tracking. Factorial is an AI-driven HR platform that covers day-to-day operations across time tracking, reporting, payroll, recruitment, performance management, and employee engagement—with AI handling tasks like timetable planning, report generation, and policy queries.
Who Is Factorial Best For?
Factorial is a strong fit for SMBs and growing companies that want AI to handle everyday HR and business operations—from timetable planning and report generation to answering employee policy questions.
Why I Picked Factorial
Factorial is one of my top picks because I love how its AI sits at the center of everyday HR operations, not just reporting. I can ask Factorial One a natural-language question and get a real-time KPI report instantly, whether that's checking turnover trends or breaking down recruitment spend by channel. It also handles timetable planning and answers employee policy questions automatically, which keeps routine requests off the HR team's plate and lets you focus on the numbers that actually matter.
Factorial Key Features
- eNPS and pulse survey tracking: Factorial's Engagement module collects employee sentiment through eNPS scores, team pulse surveys, and climate surveys, feeding results into a dedicated Engagement Insight Dashboard.
- OKR tracking module: Set and monitor objectives and key results at the individual, team, and company level, with progress linked directly to performance review workflows.
- Microsoft Power BI integration: Sync all Factorial data to Power BI for advanced, interactive visualizations beyond the platform's native dashboard capabilities.
- Compensation benchmarking via Figures: Connect employee compensation data to Figures for live market benchmarking, gender pay gap analysis, and compensation equity monitoring.
Factorial Integrations
Factorial offers native integrations with Microsoft Power BI and Figures, plus 16 recruitment and ATS integrations, including LinkedIn, Greenhouse, Workable, and Teamtailor. It also supports Zapier.
Pros and Cons
Pros:
- Links sentiment data with retention metrics
- Covers recruiting, engagement, and performance KPIs
- AI-generated reports answer everyday HR questions
Cons:
- No threshold alerts or anomaly detection
- Lacks documented predictive analytics capabilities
 Best for auto-generating auditable KPI reports
- Free plan available
- From $29/month
Visit WebsiteCustomer Rating:5/5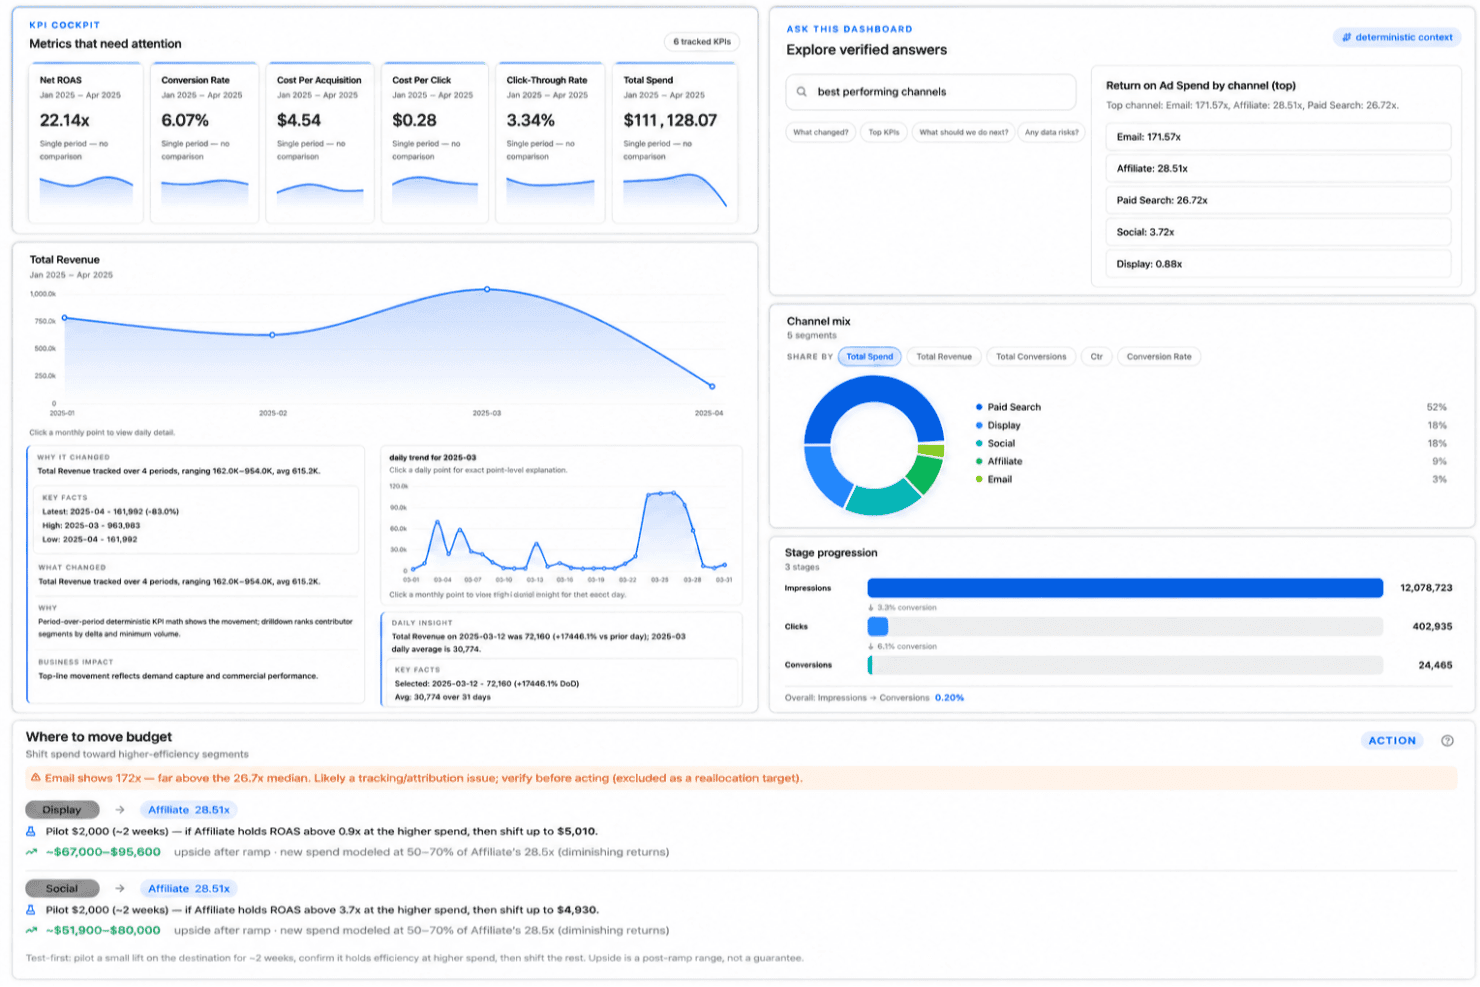
Signara has an analytics dashboard with KPI tracking, revenue trends, channel mix breakdowns, and AI-driven budget reallocation recommendations. Signara is an agentic KPI platform that pairs a deterministic metrics engine with AI-generated narratives, automated report generation, and interactive dashboards.
Who Is Signara Best For?
Signara is a strong fit for small marketing and finance teams that need board-ready KPI reports without a dedicated data analyst on staff.
Why I Picked Signara
I picked Signara as one of the best because its deterministic KPI engine separates math from AI entirely. Every number is computed in code with a full audit trail, so when I share a board deck, I can trace exactly how each figure was calculated. The AI then layers narrative on top, explaining what drove a metric shift, without ever touching the underlying math.
Signara Key Features
- Natural-language dashboard queries: Let users ask questions in plain English and get data-backed answers from dashboards.
- Multi-format report exports: Export KPI insights to PowerPoint decks, Meeting Briefs, or interactive dashboards for stakeholders.
- Data source connectors: Connect files, cloud warehouses, databases, and SaaS platforms with built-in integrations and API access.
- Role-based workspace management: Organize dashboards, reports, and data by user or team within a shared workspace environment.
Signara Integrations
Signara offers native integrations with HubSpot, Google Sheets, Snowflake, BigQuery, Databricks, PostgreSQL, MySQL, and Google Analytics 4. An API is available for custom integrations.
Pros and Cons
Pros:
- Board-ready reports auto-generated without manual work
- AI narrates what drove each metric
- Audit trail on every KPI number
Cons:
- Smaller user community than established competitors
- HR-specific KPI library is limited
Learn more about Signara: Best for custom dashboard creation
- 14-day free trial
- From $120/month (billed annually)
Visit WebsiteCustomer Rating:4.7/5
Klipfolio assembles custom KPI dashboards from many sources. If you need to build dashboards tailored to your team’s exact KPIs, Klipfolio gives you flexible tools to do just that. Marketing teams, agencies, and operations leaders use Klipfolio to connect multiple data sources and design custom visualizations that fit their unique reporting needs. Its focus on dashboard customization helps you track the metrics that matter most to your business.
Why I Picked Klipfolio
For teams that want dashboards built around their own KPIs, Klipfolio stands out for its custom dashboard creation capabilities. I picked Klipfolio because it lets you design dashboards from scratch, using a drag-and-drop editor and a wide range of visualization options. You can pull in data from dozens of sources and arrange metrics exactly how you want, making it easy to highlight the KPIs that matter most to your business. This level of customization is especially useful for organizations with unique reporting requirements or rapidly changing metrics.
Klipfolio Key Features
Some other features that make Klipfolio useful for KPI tracking include:
- Pre-Built Data Connectors: Connect quickly to popular services like Google Analytics, Salesforce, and HubSpot.
- Automated Data Refresh: Schedule regular updates so your dashboards always show current KPI data.
- Role-Based Permissions: Control who can view or edit specific dashboards and reports.
- Mobile Dashboard Access: View and interact with dashboards from any mobile device.
Klipfolio Integrations
Integrations include Google Analytics, Salesforce, HubSpot, Facebook Ads, Google Sheets, Shopify, Xero, QuickBooks, Mailchimp, and more.
Pros and Cons
Pros:
- White-labeling supports client-facing reporting
- Real-time data refresh for live dashboards
- Custom formulas allow advanced KPI calculations
Cons:
- No built-in predictive analytics for KPIs
- Data source limits on lower-tier plans
Learn more about Klipfolio: Best for strategic goal alignment
- Free trial + free demo available
- Pricing upon request
Visit WebsiteCustomer Rating:4.8/5
Cascade connects strategy goals to KPIs and initiatives. Cascade is designed for organizations that want to connect high-level strategy with measurable KPIs across teams. Strategy leaders, HR professionals, and department heads use Cascade to align goals, track progress, and ensure everyone is working toward shared outcomes. Its focus on strategic goal alignment helps you bridge the gap between planning and execution in a way that’s visible and actionable.
Why I Picked Cascade
Unlike many KPI tools that focus only on tracking metrics, Cascade stands out for its ability to connect KPIs directly to strategic goals. I picked Cascade because it lets you map out your organization’s objectives and link them to measurable outcomes, making it easier to see how daily work supports long-term strategy. The platform’s goal alignment features help you break down company-wide priorities into team and individual targets, so everyone knows what success looks like. This approach is especially useful for organizations that want to ensure every KPI is tied to a bigger-picture objective.
Cascade Key Features
In addition to its goal alignment capabilities, Cascade offers several other features for KPI management:
- Automated Progress Tracking: The platform updates KPI progress automatically as data is entered or synced.
- Custom Dashboard Builder: Create personalized dashboards to visualize KPIs and strategic metrics.
- Collaboration Tools: Assign tasks, comment on goals, and share updates within the platform.
- Strategy Map Visualization: View how different goals and KPIs connect using interactive strategy maps.
Cascade Integrations
Integrations include Salesforce, Asana, SAP, Snowflake, Oracle, Tableau, BambooHR, and HubSpot.
Pros and Cons
Pros:
- Supports automated progress tracking on goals
- Offers visual strategy mapping for KPIs
- Links KPIs directly to strategic objectives
Cons:
- Static and rigid printed reports
- Limited export options for KPI reports
Learn more about Cascade: Best for advanced data visualization
- 14-day free trial
- Pricing upon request
Visit WebsiteCustomer Rating:4.5/5
Tableau builds interactive KPI visuals from complex data. When you need to turn complex data into clear, interactive visuals, Tableau is a top choice. Data analysts, business intelligence teams, and operations leaders use Tableau to build advanced dashboards that make KPI trends and outliers easy to spot. Its flexible visualization tools help you dig into large datasets and share insights with stakeholders across your organization.
Why I Picked Tableau
Unlike many KPI tools that offer basic charts, Tableau gives you advanced data visualization options that help you uncover deeper insights. I picked Tableau because it lets you build interactive dashboards with custom filters, drill-downs, and dynamic visual elements that make KPI data more actionable. Its ability to handle large, complex datasets means you can visualize trends, outliers, and relationships that might otherwise go unnoticed. For teams that need to present KPIs in a visually compelling and flexible way, Tableau offers a level of control and sophistication that’s hard to match.
Tableau Key Features
Some other features that make Tableau valuable for KPI tracking include:
- Scheduled Data Refreshes: Set up automatic updates to ensure dashboards always display the latest KPI data.
- Data Blending: Combine data from multiple sources within a single visualization for a more complete KPI view.
- Role-Based Access Controls: Manage who can view or edit specific dashboards and reports.
- Mobile Dashboard Support: Access and interact with KPI dashboards from smartphones and tablets.
Tableau Integrations
Native integrations are not currently listed.
Pros and Cons
Pros:
- Offers advanced drill-down and filtering options
- Handles large datasets without lags
- Supports highly interactive KPI dashboards
Cons:
- Lacks built-in KPI goal tracking templates
- Requires desktop app for full dashboard creation
Learn more about Tableau: Best for financial metric visualization
- 7-day free trial + free demo available
- From $15/month
Visit WebsiteCustomer Rating:4.6/5
Fathom turns accounting data into forecasts and KPI reports. Fathom is designed for finance teams and business leaders who need to visualize and analyze financial KPIs with clarity. Its interactive dashboards and in-depth financial analysis tools help you turn accounting data into actionable insights. If your priority is understanding profitability, cash flow, and growth trends at a glance, Fathom offers specialized features for financial metric visualization.
Why I Picked Fathom
When it comes to visualizing financial metrics, Fathom offers a level of depth that’s hard to match in KPI software. I picked Fathom because its financial analysis tools let you break down profitability, cash flow, and growth trends using interactive charts and visual reports. The platform’s KPI builder allows you to create custom financial metrics tailored to your business, while its benchmarking feature helps you compare performance across multiple entities or periods. For finance teams that need to turn complex accounting data into clear, actionable visuals, Fathom is purpose-built for the job.
Fathom Key Features
Some other features that make Fathom valuable for KPI tracking include:
- Automated Consolidations: Combine financial data from multiple entities for group reporting.
- Report Editor: Build and customize visual reports with drag-and-drop tools.
- Forecasting Module: Project future financial performance using built-in forecasting tools.
- Alerts and Notifications: Set up automated alerts for key financial thresholds or metric changes.
Fathom Integrations
Integrations include QuickBooks Online, QuickBooks Desktop, Xero, MYOB AccountRight, Excel, Google Sheets, and more.
Pros and Cons
Pros:
- Offers customizable financial report templates
- Consolidates data from multiple entities
- Visualizes financial KPIs with interactive charts
Cons:
- Manual data refresh needed for some sources
- Limited non-financial KPI tracking options
Learn more about Fathom: Best for marketing analytics integration
- Free plan + 14-day free trial + demo available
- From $20/user/month
Visit WebsiteCustomer Rating:4.4/5
HubSpot ties marketing KPIs to campaigns and CRM activity. If you’re looking for KPI software that connects marketing analytics with sales and service data, HubSpot is worth considering. Marketing teams and revenue leaders use HubSpot to track campaign performance, website engagement, and lead conversion in one place. Its unified dashboard helps you visualize marketing KPIs alongside other business metrics for a complete view of your funnel.
Why I Picked HubSpot
For teams that need to connect marketing analytics directly to their KPI tracking, HubSpot stands out for its unified approach. I picked HubSpot because it lets you pull campaign, website, and lead data into customizable dashboards, so you can monitor marketing performance in real time. The platform’s attribution reporting helps you see which channels drive conversions, while its funnel analytics break down each stage of the customer journey. If you want to measure marketing KPIs alongside sales and service metrics, HubSpot brings everything together in one place.
HubSpot Key Features
Some other features that make HubSpot useful for KPI tracking include:
- Custom Report Builder: Create tailored reports using data from multiple sources within HubSpot.
- Automated Email Tracking: Monitor email open rates, click rates, and engagement metrics automatically.
- Contact and Company Scoring: Assign scores to leads and accounts based on custom criteria and behaviors.
- Workflow Automation: Set up automated processes to update KPIs or trigger actions based on specific events.
HubSpot Integrations
Integrations include Gmail, Outlook, Google Calendar, Microsoft Teams, Slack, Salesforce, Zoom, WordPress, Google Meet, and more.
Pros and Cons
Pros:
- Tracks website and landing page analytics
- Offers multi-touch attribution reporting
- Connects marketing, sales, and service KPIs
Cons:
- Custom event tracking setup can be complex
- Limited financial KPI tracking capabilities
Learn more about HubSpot: Best for mobile performance monitoring
- Free plan + 14-day free trial + free demo available
- From $71/month (billed annually)
Visit WebsiteCustomer Rating:4.5/5
Databox shows KPI dashboards on mobile and screens fast. Databox stands out for teams that need to monitor KPIs and business performance on the go. Its mobile-first dashboards and real-time alerts make it a strong fit for marketing agencies, sales teams, and executives who want instant access to data from anywhere. If you’re looking for KPI dashboard software that prioritizes mobile performance monitoring and quick insights, Databox is built for that need.
Why I Picked Databox
Mobile performance monitoring is where Databox really shines, making it a strong choice for KPI software if you need real-time access to business data from anywhere. I picked Databox because its mobile app delivers live dashboards, push notifications, and instant alerts, so you never miss a key metric or sudden change. The platform also lets you customize mobile dashboards for different roles, ensuring that each team member sees the most relevant KPIs on their device. For organizations that value on-the-go decision-making, Databox puts actionable insights right in your pocket.
Databox Key Features
Some other features that make Databox useful for KPI tracking include:
- Data Calculations: Create custom metrics by combining data from multiple sources within the platform.
- Goal Tracking: Set, monitor, and visualize progress toward specific business goals directly in your dashboards.
- Scheduled Reporting: Automate the delivery of performance reports to your team or stakeholders on a set schedule.
- Data Snapshots: Capture and share static views of your dashboards for quick updates or presentations.
Databox Integrations
Integrations include Google Analytics 4, HubSpot Marketing, HubSpot CRM, Google Sheets, Facebook Ads, Excel, LinkedIn Ads, Shopify, and more.
Pros and Cons
Pros:
- Push notifications for metric shifts
- Native connectors for 100+ sources
- Mobile app delivers real-time KPI alerts
Cons:
- Custom metric setup can be time-consuming
- Limited historical data retention on lower plans
Learn more about Databox: 9Best for enterprise data connectivity
Domo
- 30-day free trial
- Pricing upon request
Visit WebsiteCustomer Rating:4.4/5
Domo centralizes enterprise KPIs with governance and automation. Domo is built for organizations that need to connect and analyze data from a wide range of enterprise systems. IT leaders, data analysts, and operations teams use Domo to unify data sources and manage KPIs across complex business environments. Its strength in large-scale data connectivity helps you monitor performance metrics from every corner of your organization.
Why I Picked Domo
When you need to bring together data from dozens or even hundreds of enterprise systems, Domo’s data connectivity features make it a strong choice for KPI software. I picked Domo because it offers built-in data pipelines and connectors that let you centralize information from cloud apps, databases, and on-premise sources. Its data transformation tools help you clean and prepare data for KPI tracking without leaving the platform. This level of connectivity is especially valuable for organizations with complex data environments and a need for unified, organization-wide KPI monitoring.
Domo Key Features
Some other features that make Domo useful for KPI management include:
- Custom Alerts: Set up automated notifications when KPIs hit specific thresholds.
- Data Visualization Library: Access a wide range of chart types and visual widgets for KPI reporting.
- Mobile App Access: Monitor and interact with dashboards from any mobile device.
- Embedded Analytics: Integrate Domo dashboards and KPI reports directly into other business applications.
Domo Integrations
Integrations include Salesforce, SAP, Google Sheets, MySQL, HubSpot, Shopify, Oracle, and Snowflake.
Pros and Cons
Pros:
- Embedded analytics for sharing KPI dashboards
- No-code ETL data transformation
- Custom alerts for KPI threshold monitoring
Cons:
- Significant latency with complex dataflows
- Unpredictable consumption-based credit pricing
Learn more about Domo: 10Best for integrated business management
KPI
- 14-day free trial
- From $19.99/month
Visit WebsiteCustomer Rating:4.5/5
KPI focuses on financial KPIs inside an all-in-one suite. KPI brings together KPI tracking with a full suite of business management tools in one platform. It’s a strong choice for organizations that want to connect performance metrics with accounting, HR, CRM, and project management in a single system. If you’re looking for KPI software that supports integrated workflows across multiple business functions, KPI is designed to centralize your data and processes.
Why I Picked KPI
What sets KPI apart is its ability to combine KPI tracking with a full suite of integrated business management tools. I picked this platform because it lets you monitor performance metrics alongside accounting, HR, CRM, and project management—all within the same environment. This integration means you can connect your KPIs directly to operational data, making it easier to see how business activities impact results. For teams that want to manage both their metrics and their day-to-day operations in one place, KPI offers a unified approach that’s hard to find elsewhere.
KPI Key Features
In addition to its integrated business management capabilities, KPI offers several other features worth noting:
- Customizable Dashboards: Build dashboards tailored to your team’s specific KPIs and reporting needs.
- Automated Alerts: Set up notifications to flag when KPIs hit certain thresholds or targets.
- Document Management: Store and organize files related to your KPIs and business processes within the platform.
- Multi-Currency Support: Track and report on KPIs across different currencies for global operations.
KPI Integrations
Integrations include Microsoft Office, PayPal, Stripe, and more.
Pros and Cons
Pros:
- Multi-currency support for global teams
- Built-in document management for KPI files
- Combines KPI tracking with business management
Cons:
- Limited visualization options for advanced users
- Interface can feel cluttered with features
Learn more about KPI:
Diğer KPI Yazılımları
İşte kısa listeme giremeyen ancak yine de göz atmaya değer bazı ek KPI yazılımı seçenekleri:
- 11SimpleKPIBest for quick metric tracking setup
- 12Spider ImpactBest for balanced scorecard frameworks
- 13Qlik Cloud AnalyticsBest for interactive data exploration
- 14ScoroBest for project performance insights
- 15monday AI WorkspaceBest with AI-powered project risk detection
- 16PeopleGoalBest for employee performance tracking
How I Evaluate KPI Software
I evaluate HR KPI software in two layers—baseline capabilities like turnover dashboards and HRIS integrations, and the differentiators like predictive analytics that set vendors apart.
Core Functionality (Table Stakes For This List)
When I'm selecting tools for my list, I rank each one on a scale from 0 (does not offer the functionality) to 5 (excels in this area) for each core functionality listed below. Then, I calculate the tool's total score into a percentage. Each tool needs to achieve a minimum total score of 65% to be considered for inclusion.
- HR KPI Library: I check whether the platform ships with ready-to-use HR metrics like turnover rate, absenteeism, and time-to-fill so teams aren't building every KPI from scratch.
- Custom KPI Builder: The ability to define formulas matters—for example, creating a weighted quality-of-hire metric that blends performance scores with retention data.
- HR Data Integrations: I evaluate native connectors to HRIS, ATS, and payroll systems, since pulling headcount from one tool and compensation data from another is the norm.
- KPI Dashboards & Visualization: Real-time, interactive dashboards are what I look for—drill-downs that let a CHRO move from an org-wide retention score to a department-level view.
- Automated Reporting & Alerts: Scheduled delivery of monthly board-ready reports and threshold alerts (e.g., when voluntary turnover spikes above target) save hours of manual work.
- Goal & Target Tracking: I look at how well a platform supports cascading targets, such as tying a recruiter's time-to-hire goal to a broader talent acquisition KPI owned by the director.
Once I have a list of tools that meet this criteria, I consider what sets each platform apart.
Differentiating Factors (What Sets Vendors Apart)
Here's how I compare and contrast different vendors:
Standout Features
Predictive analytics is a major differentiator—I look for platforms that can flag flight-risk employees or forecast hiring demand based on historical trends. Industry benchmarking data also matters, since comparing your turnover rate against peers gives HR leaders context raw numbers alone can't provide. I evaluate DEI metric capabilities too, specifically whether a tool can segment KPIs by demographics to surface pay equity gaps or representation trends across levels.
Beyond Features
Compliance and data privacy top my list—HR KPI platforms handle sensitive employee data, so I check for SOC 2 certification, role-based access controls, and data residency options for multi-region teams. Scalability is another factor I evaluate closely, particularly whether a tool can handle growing headcounts and multi-entity structures without performance issues. I also consider implementation support, since platforms that offer HR-specific onboarding consultants and prebuilt KPI templates tend to deliver value much faster than those requiring months of custom configuration.
KPI Yazılımı Nasıl Seçilir?
Uzun özellik listeleri ve karmaşık fiyatlandırma yapılarına takılıp kalmak kolaydır. Benzersiz yazılım seçim süreciniz üzerinde çalışırken odağınızı korumanıza yardımcı olmak için göz önünde bulundurmanız gereken faktörleri içeren bir kontrol listesi hazırladık:
| Faktör | Dikkat Edilmesi Gerekenler |
| Ölçeklenebilirlik | Yazılım, zaman içinde veri hacminizi ve kullanıcı sayısındaki artışı kaldırabilecek mi? Kullanıcı sınırlarını, veri kotalarını ve yükseltme seçeneklerini kontrol edin. |
| Entegrasyonlar | İnsan kaynakları bilgi sisteminize, bordro sisteminize, CRM'inize veya analiz araçlarınıza yerel olarak bağlanabiliyor mu? Mevcut teknoloji yığınınızla uyumluluğunu doğrulayın. |
| Özelleştirilebilirlik | Panoları, KPI'ları ve raporları kuruluşunuzun ihtiyaçlarına göre uyarlayabiliyor musunuz? Katı şablonlara veya sınırlı düzenleme seçeneklerine dikkat edin. |
| Kullanım kolaylığı | Ekibiniz yazılımı hızlı bir şekilde benimseyecek mi? Sezgisel gezinme, anlaşılır etiketler ve minimum eğitim gereksinimleri arayın. |
| Uygulama ve işe alıştırma | Kurulum ne kadar sürecek ve hangi kaynaklara ihtiyaç duyulacak? Veri taşıma desteği, işe alıştırma yardımı ve tipik kullanıma geçiş süreleri hakkında bilgi alın. |
| Maliyet | Fiyatlandırma katmanları şeffaf ve öngörülebilir mi? Kullanıcı lisanslarını, eklentileri ve olası ek kullanım ücretlerini hesaba katın. Toplam sahip olma maliyetini karşılaştırın. |
| Güvenlik önlemleri | Araç, kuruluşunuzun veri gizliliği ve güvenlik standartlarını karşılıyor mu? Şifreleme, erişim denetimleri ve uyumluluk sertifikalarını arayın. |
| Destek erişilebilirliği | Hangi destek kanalları sunuluyor ve hangi saatlerde hizmet veriliyor? 7/24 yardıma, özel müşteri temsilcilerine veya self servis kaynaklarına ihtiyacınız olup olmadığını değerlendirin. |
KPI Yazılımı Nedir?
KPI yazılımı, kuruluşların temel performans göstergelerini gerçek zamanlı olarak izlemek, görselleştirmek ve analiz etmek için KPI'lardan yararlanmasına yardımcı olan dijital bir araçtır. Bulut tabanlı bu platformlar, birden fazla kaynaktaki verileri merkezileştirerek ekiplerin işletme KPI'larını ve hedeflere doğru ilerlemeyi izlemesine, eğilimleri belirlemesine ve daha iyi kararlar almasına olanak tanır. KPI yazılımları; insan kaynakları profesyonelleri, yöneticiler ve işletme liderleri tarafından stratejik hedeflerle uyumu sağlamak ve veriye dayalı performans yönetimini desteklemek için kullanılır.
Özellikler
KPI yazılımını seçerken aşağıdaki temel özelliklere dikkat edin:
- Özel gösterge tablosu oluşturma: Farklı ekipler veya roller için en ilgili KPI'ları görüntülemek üzere gösterge tabloları oluşturun ve kişiselleştirin; böylece en önemli konulara odaklanmak kolaylaşır.
- Veri kaynağı entegrasyonu: KPI takibi için güncel bilgileri otomatik olarak almak üzere elektronik tablolar, veritabanları ve bulut uygulamaları gibi çeşitli veri kaynaklarına bağlanın.
- Gerçek zamanlı veri güncellemeleri: Veriler değiştikçe en güncel performans ölçümlerini görüntüleyerek bilinçli kararlar alın.
- Role dayalı erişim kontrolleri: Kullanıcıların yalnızca sorumluluklarıyla ilgili KPI'ları ve verileri görmesini sağlayacak izinler belirleyerek veri gizliliğini ve açıklığı destekleyin.
- Otomatik raporlama: KPI raporlarını düzenli aralıklarla planlayıp paydaşlara dağıtarak manuel çalışmayı azaltın ve herkesin bilgi sahibi olmasını sağlayın.
- Hedef ve amaç belirleme: Belirli KPI hedefleri tanımlayın ve bunlara yönelik ilerlemeyi takip ederek ekiplerin kurumsal hedeflerle uyumlu kalmasına yardımcı olun.
- Detaylandırma özellikleri: Temel verileri incelemek ve performansı etkileyen faktörleri ortaya çıkarmak için KPI'ların ayrıntılarına tıklayarak daha derin analiz yapmayı destekleyin.
- Geçmiş eğilim analizi: Kalıpları, mevsimselliği veya uzun vadeli değişimleri belirlemek için geçmiş KPI verilerini inceleyerek tahmin ve stratejik planlamaya yardımcı olun.
- Mobil erişilebilirlik: Kullanıcıların hareket hâlindeyken KPI'ları izlemesine olanak tanımak için gösterge tablolarına ve raporlara mobil cihazlardan erişin.
- Dışa aktarma ve paylaşma seçenekleri: Gösterge tablolarını veya raporları çeşitli biçimlerde kolayca dışa aktarın ve gerektiğinde iş arkadaşlarınızla veya harici iş ortaklarınızla paylaşın.
Yaygın KPI Yazılımı Yapay Zekâ Özellikleri
Yukarıda listelenen standart KPI yazılımı özelliklerinin yanı sıra bu çözümlerin çoğu aşağıdaki gibi özelliklerle yapay zekâyı bünyesine katıyor:
- Otomatik anormallik tespiti: Yapay zekâ algoritmaları, olağandışı kalıpları veya aykırı değerleri belirlemek için KPI verilerini tarar; manuel izleme gerektirmeden kullanıcıları olası sorunlar veya beklenmeyen değişiklikler konusunda uyarır.
- Tahmine dayalı analiz: Yapay zekâ modelleri, gelecekteki performansı tahmin etmek için geçmiş KPI eğilimlerini analiz ederek ekiplerin zorlukları ve fırsatları ortaya çıkmadan önce öngörmesine yardımcı olur.
- Doğal dil sorguları: Kullanıcılar KPI'ları hakkında günlük dille sorular sorabilir; yapay zekâ da bunları yorumlayarak ilgili verileri veya görselleştirmeleri sunar ve içgörüleri daha erişilebilir hâle getirir.
- Otomatik içgörü oluşturma: Yazılım, KPI değişikliklerinin ardındaki temel bulguları, korelasyonları veya etkenleri ortaya çıkarmak için yapay zekâdan yararlanarak manuel veri inceleme ihtiyacını azaltır.
- Akıllı uyarılar: Yapay zekâ, uyarıları KPI değişikliklerinin önemine ve bağlamına göre önceliklendirip özelleştirerek kullanıcıların yalnızca gerçekten harekete geçilmesi gerektiğinde bilgilendirilmesini sağlar.
Faydalar
KPI yazılımını uygulamak ekibiniz ve işletmeniz için çeşitli faydalar sağlar. Yararlanmayı bekleyebileceğiniz birkaç fayda şunlardır:
- Merkezi performans takibi: Birden fazla kaynaktan gelen verileri entegre edip özel gösterge tablolarında görselleştirerek tüm temel ölçümlerinizi tek bir yerden izleyin.
- Daha hızlı, veriye dayalı kararlar: Gerçek zamanlı KPI güncellemelerine ve otomatik raporlara erişerek ekibinizin değişen iş koşullarına hızlı tepki vermesini sağlayın.
- Geliştirilmiş hedef uyumu: Ekipler arasında KPI hedefleri belirleyin, takip edin ve iletin; böylece herkesin ortak kurumsal hedeflere ulaşmak için çalışmasını sağlayın.
- Geliştirilmiş hesap verebilirlik: Role dayalı erişim atayın ve hedeflere yönelik ilerlemeyi takip ederek her KPI'dan kimin sorumlu olduğunu netleştirin.
- Daha derin performans içgörüleri: KPI değişikliklerinin ardındaki temel nedenleri ortaya çıkarmak için detaylandırma analizinden, geçmiş eğilim incelemelerinden ve yapay zekâ destekli içgörülerden yararlanın.
- Sorunların proaktif tespiti: Sorunlar büyümeden önce sizi olası problemler konusunda bilgilendiren otomatik anormallik tespitinden ve akıllı uyarılardan yararlanın.
- Daha fazla şeffaflık ve iş birliği: Gösterge tablolarını ve raporları kolayca paylaşarak paydaşları bilgilendirin ve performans verileri konusunda açıklık kültürünü destekleyin.
Maliyetler ve Fiyatlandırma
KPI yazılımını seçmek, mevcut çeşitli fiyatlandırma modellerinin ve planların anlaşılmasını gerektirir. Maliyetler özelliklere, ekip büyüklüğüne, eklentilere ve daha fazlasına göre değişir. Aşağıdaki tablo, KPI yazılımı çözümlerinde yaygın olarak sunulan planları, ortalama fiyatlarını ve tipik özelliklerini özetlemektedir:
KPI Yazılımı İçin Plan Karşılaştırma Tablosu
| Plan Türü | Ortalama Fiyat | Yaygın Özellikler |
| Ücretsiz Plan | $0 | Temel gösterge paneli oluşturma, sınırlı veri entegrasyonları, standart raporlama ve topluluk desteği. |
| Bireysel Plan | $5-$25/kullanıcı/ay | Özel gösterge panelleri, daha fazla veri kaynağı, temel uyarılar, dışa aktarma seçenekleri ve e-posta desteği. |
| İşletme Planı | $25-$60/kullanıcı/ay | Gelişmiş entegrasyonlar, ekip iş birliği araçları, role dayalı erişim, zamanlanmış raporlar ve sohbet desteği. |
| Kurumsal Plan | $60-$120/ kullanıcı/ay | Sınırsız kullanıcı, özel işe alıştırma, gelişmiş güvenlik, özel hesap yönetimi ve SLA destekli destek. |
KPI Yazılımı SSS
KPI yazılımı hakkında sık sorulan soruların bazı yanıtları burada yer alıyor:
Kuruluşumun KPI yazılımına ihtiyacı olup olmadığını nasıl anlayabilirim?
Ekipler genelinde performans ölçütlerini takip etmekte zorlanıyorsanız, manuel elektronik tablolara güveniyorsanız veya zamanında içgörülere ulaşamıyorsanız KPI yazılımı verileri düzenlemenize ve raporlamayı otomatikleştirmenize yardımcı olabilir. Kuruluşunuz büyüdükçe ve veri kaynaklarınız çoğaldıkça daha iyi raporlama araçlarına ihtiyaç duyacağınız için bu yazılım özellikle kullanışlıdır.
KPI yazılımı mevcut İK ve işletme sistemlerimle entegre olabilir mi?
Evet, çoğu KPI yazılımı çözümü HRIS, bordro, CRM ve diğer işletme araçlarıyla entegrasyonlar sunar. Mevcut sistemlerinizle uyumluluğu her zaman doğrulayın ve entegrasyonların yerel olarak mı sunulduğunu yoksa üçüncü taraf bağlayıcılar mı gerektirdiğini kontrol edin.
KPI yazılımı sağlayıcılarını değerlendirirken nelere dikkat etmeliyim?
Ölçeklenebilirliğe, entegrasyon seçeneklerine, özelleştirilebilirliğe, kullanım kolaylığına ve güvenlik önlemlerine odaklanın. İşe alıştırma desteğini, müşteri hizmetlerinin erişilebilirliğini ve fiyatlandırma modelinin bütçenize ve büyüme planlarınıza uygun olup olmadığını sorun.
KPI yazılımının uygulanması ne kadar sürer?
Uygulama süreleri değişiklik gösterir. Bazı araçlar önceden oluşturulmuş şablonlarla birkaç saat içinde kurulabilirken, diğerleri veri geçişi, entegrasyon ve eğitim için haftalar gerektirebilir. Sağlayıcılara tipik işe alıştırma sürelerini ve mevcut destek kaynaklarını sorun.
KPI yazılımı platformlarında verilerim güvende mi?
Saygın KPI yazılımı sağlayıcılarının çoğu verilerinizi korumak için şifreleme, erişim denetimleri ve uyumluluk sertifikaları kullanır. Her sağlayıcının güvenlik belgelerini mutlaka inceleyin ve gizlilik ile mevzuata uyumluluk yaklaşımlarını sorun.