Le 10 Migliori Soluzioni di Business Intelligence del 2026

10 Migliori Software di Business Intelligence


Gestire le complessità delle risorse umane può essere travolgente. Stai gestendo dati, bisogni dei dipendenti e obiettivi strategici. Un software di business intelligence può alleggerire questi oneri, trasformando il caos in chiarezza.
Per esperienza, gli strumenti giusti offrono approfondimenti che permettono al tuo team di prendere decisioni informate. Troverai soluzioni che affrontano le tue sfide specifiche, dall’analisi delle tendenze della forza lavoro all’ottimizzazione dell’allocazione delle risorse.
Ho testato e recensito in modo indipendente i migliori software di business intelligence sul mercato. Questo elenco ti offrirà una panoramica imparziale delle migliori opzioni disponibili, concentrandosi sulle caratteristiche più rilevanti per il tuo team.
Table of Contents
Perché Fidarti delle Nostre Recensioni Software
Testiamo e recensiamo sistemi software HR dal 2019. In quanto esperti HR, sappiamo quanto sia fondamentale e allo stesso tempo difficile prendere la decisione giusta nella scelta di un software. Investiamo molto nella ricerca approfondita per aiutare il nostro pubblico a prendere decisioni d’acquisto migliori. Abbiamo testato più di 2.000 strumenti per diversi casi d’uso nell’ambito HR e scritto oltre 1.000 recensioni approfondite. Scopri come rimaniamo trasparenti & la nostra metodologia di valutazione software.
Riepilogo dei Migliori Software di Business Intelligence
Questa tabella comparativa riassume i dettagli sui prezzi delle mie principali selezioni di software di business intelligence per aiutarti a trovare quello più adatto al tuo budget e ai bisogni aziendali.rnrn
| Tool | Best For | Trial Info | Price | ||
|---|---|---|---|---|---|
| 1 | Ideale per la reportistica interattiva su fogli di calcolo | Piano gratuito disponibile | A partire da $49/mese (fatturazione annuale) | Website | |
| 2 | Arricchisci i tuoi dati e prevedi le tendenze future | Prova gratuita di 15 giorni | A partire da $24/mese | Website | |
| 3 | Ideale per dashboard automatizzati, senza codice | Piano gratuito disponibile | A partire da $29/mese | Website | |
| 4 | Crea dashboard e rispondi alle domande dei clienti sulla stessa piattaforma | Prova gratuita di 14 giorni | A partire da $99/mese | Website | |
| 5 | Crea esperienze di analytics con marchio personalizzato | Prova gratuita di 14 giorni | Prezzi su richiesta | Website | |
| 6 | Monitora l'efficienza dei tuoi reparti o membri del team | Prova gratuita disponibile | Prezzi su richiesta | Website | |
| 7 | Semplifica i processi di reportistica ricorrente con l'automazione | Prova gratuita di 15 giorni | A partire da $73/mese | Website | |
| 8 | Trasforma i dati grezzi in storie guidate dai dati | Prova gratuita di 14 giorni | Da $249/mese | Website | |
| 9 | Ideale per trasformare i dati in insight guidati dall'IA | Demo gratuita disponibile | Prezzi su richiesta | Website | |
| 10 | Risparmia tempo con modelli di report personalizzati | Demo gratuita disponibile | Prezzo su richiesta | Website |
-

Justworks
Visit WebsiteThis is an aggregated rating for this tool including ratings from Crozdesk users and ratings from other sites.4.6 -
Paycom
Visit WebsiteThis is an aggregated rating for this tool including ratings from Crozdesk users and ratings from other sites.4.3 -
Native Teams
Visit WebsiteThis is an aggregated rating for this tool including ratings from Crozdesk users and ratings from other sites.4.6


Sistemi Software di Business Intelligence Migliori
Ecco una breve descrizione di ciascun sistema software di business intelligence per illustrarne il miglior caso d’uso, alcune caratteristiche degne di nota e screenshot per mostrarti l’interfaccia utente.

Per le aziende che cercano una soluzione dinamica di software di business intelligence, Coefficient offre un approccio innovativo trasformando i fogli di calcolo in potenti applicazioni di dati senza bisogno di programmare. Questo strumento è particolarmente interessante per i professionisti della finanza, del marketing e delle operazioni di guadagno che desiderano semplificare la gestione e la reportistica dei dati. Con Coefficient, puoi affrontare le sfide dell'accesso ai dati in tempo reale e della reportistica automatizzata, dando al tuo team la possibilità di prendere decisioni informate rapidamente.
Perché ho scelto Coefficient
Ho scelto Coefficient perché eccelle nel trasformare i tradizionali fogli di calcolo in applicazioni di dati interattive, un elemento distintivo nel panorama dei software di business intelligence. La funzione di analisi dei dati in tempo reale permette di collegarsi a oltre 100 fonti di dati, fornendo informazioni essenziali per prendere decisioni tempestive. Inoltre, le dashboard guidate dall'intelligenza artificiale offrono un modo sofisticato di visualizzare set di dati complessi, permettendo al tuo team di identificare facilmente trend e schemi. Questa combinazione di funzionalità risponde all'esigenza di flussi di lavoro dei dati più snelli e maggiore produttività.
Funzionalità chiave di Coefficient
Oltre alle sue capacità uniche, ho riscontrato anche altre caratteristiche di valore:
- Reporting automatizzato: Lo strumento automatizza il processo di reportistica, facendo risparmiare tempo al team e riducendo il rischio di errori umani.
- Strumenti di trasformazione dei dati: Coefficient offre strumenti avanzati per la pulizia e la trasformazione dei dati, assicurando l'accuratezza e l'affidabilità delle informazioni.
- Dashboard guidate dall'IA: Queste dashboard propongono opzioni di visualizzazione avanzate, aiutando a interpretare con facilità dati complessi.
- Connettori predefiniti: Con oltre 100 connettori predefiniti, Coefficient permette un'integrazione fluida con diverse fonti di dati, ampliando le tue capacità di accesso alle informazioni.
Integrazioni di Coefficient
Le integrazioni comprendono Salesforce, QuickBooks, Snowflake, Tableau, HubSpot, MySQL, Redshift, Looker, Google Sheets ed Excel.
Pros and Cons
Pros:
- Supporta workflow di reporting su fogli di calcolo in tempo reale
- Integrazione con oltre 100 connettori predefiniti con un solo clic
- Consente di impostare avvisi personalizzabili via Slack ed Email
Cons:
- I limiti di utilizzo del piano gratuito possono risultare restrittivi per alcune aziende
- Alcuni connettori predefiniti come BigQuery, Sage Intacct sono disponibili solo nel piano enterprise
Zoho Analytics è uno strumento di business intelligence (BI) che aiuta le organizzazioni a raccogliere e monitorare i dati. Il software acquisisce dati da molteplici fonti e li organizza in dashboard chiare, permettendoti di analizzare le informazioni in modo flessibile.
Con Zoho Analytics puoi tenere traccia dei principali indicatori di business per individuare tendenze comportamentali. Il modulo di gestione basato su intelligenza artificiale del software ti aiuta ad arricchire i tuoi dati per prevedere le tendenze future e generare approfondimenti.
Zoho Analytics si integra con centinaia di app popolari, tra cui Salesforce, Google Drive, QuickBooks, Zendesk, HubSpot e Mailchimp.
Zoho Analytics costa a partire da $24/mese. Il software offre anche una prova gratuita di 15 giorni.

Signara è una piattaforma di analytics per il marketing che utilizza AI agentica e calcoli deterministici dei KPI per automatizzare la creazione di dashboard, l’analisi dei driver e la generazione di report pronti per le decisioni a partire da fonti di dati collegate.
Per chi è ideale Signara?
Signara è perfetto per team di marketing e analisti che necessitano di report automatizzati pronti per la presentazione, senza dover gestire manualmente i dati.
Perché ho scelto Signara
Ho scelto Signara tra i migliori perché il suo approccio alla privacy dei dati è integrato nel processo di elaborazione e non aggiunto successivamente. Signara esegue solo query in sola lettura sulle fonti collegate e non memorizza mai i dati grezzi, assicurando che i dati sensibili di marketing e di ricavo rimangano nel loro luogo d’origine. Ogni KPI viene calcolato con una formula deterministica e verificabile, garantendo la tracciabilità completa di ogni numero presente in ogni report.
Funzionalità principali di Signara
- Generazione di report tramite AI agentica: L’agente AI di Signara costruisce automaticamente report di analytics completi a partire dai dati collegati, senza configurazione manuale.
- Analisi dei driver: Identifica quali variabili sono maggiormente responsabili dei cambiamenti nei tuoi KPI in un certo periodo di tempo.
- Narrazioni generate dall’AI: Crea spiegazioni in linguaggio naturale delle tendenze dei tuoi dati direttamente all’interno di ogni report.
- Esportazione in PPTX: Converte i report completati in file PowerPoint pronti per la presentazione e la condivisione con i portatori di interesse.
La ricerca non ha restituito risultati specifici per Zapier o API su Signara. Sulla base dei contenuti raccolti dal sito ufficiale, dispongo di informazioni sufficienti per scrivere la sezione delle integrazioni in modo accurato.
Integrazioni di Signara
Signara offre un piccolo set di connettori nativi, tra cui Snowflake, Databricks, BigQuery, PostgreSQL, MySQL, Google Sheets e HubSpot, oltre al supporto per il caricamento di file Excel, CSV, TSV e JSON.
Pros and Cons
Pros:
- Le narrazioni generate dall’AI spiegano automaticamente i cambiamenti dei KPI
- I calcoli deterministici eliminano il rischio di allucinazioni dell’AI
- L’esportazione in PPTX produce presentazioni pronte all’istante
Cons:
- Limitato al reporting di KPI orientati al marketing
- Nessun aggiornamento in tempo reale delle dashboard nei piani inferiori
Crea dashboard e rispondi alle domande dei clienti sulla stessa piattaforma
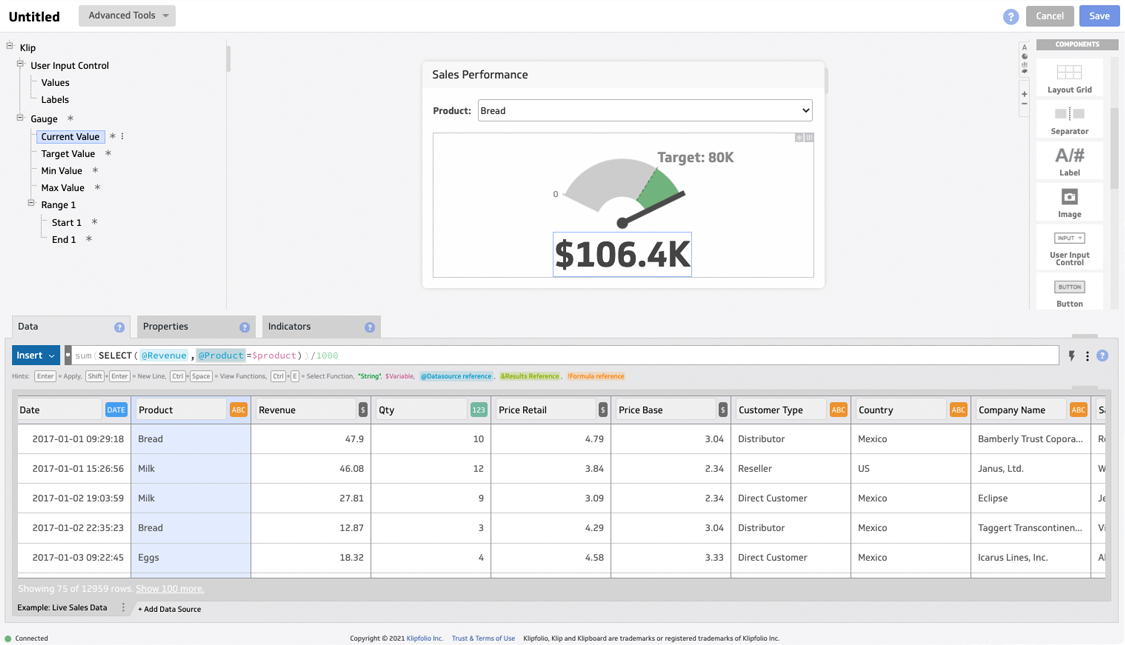
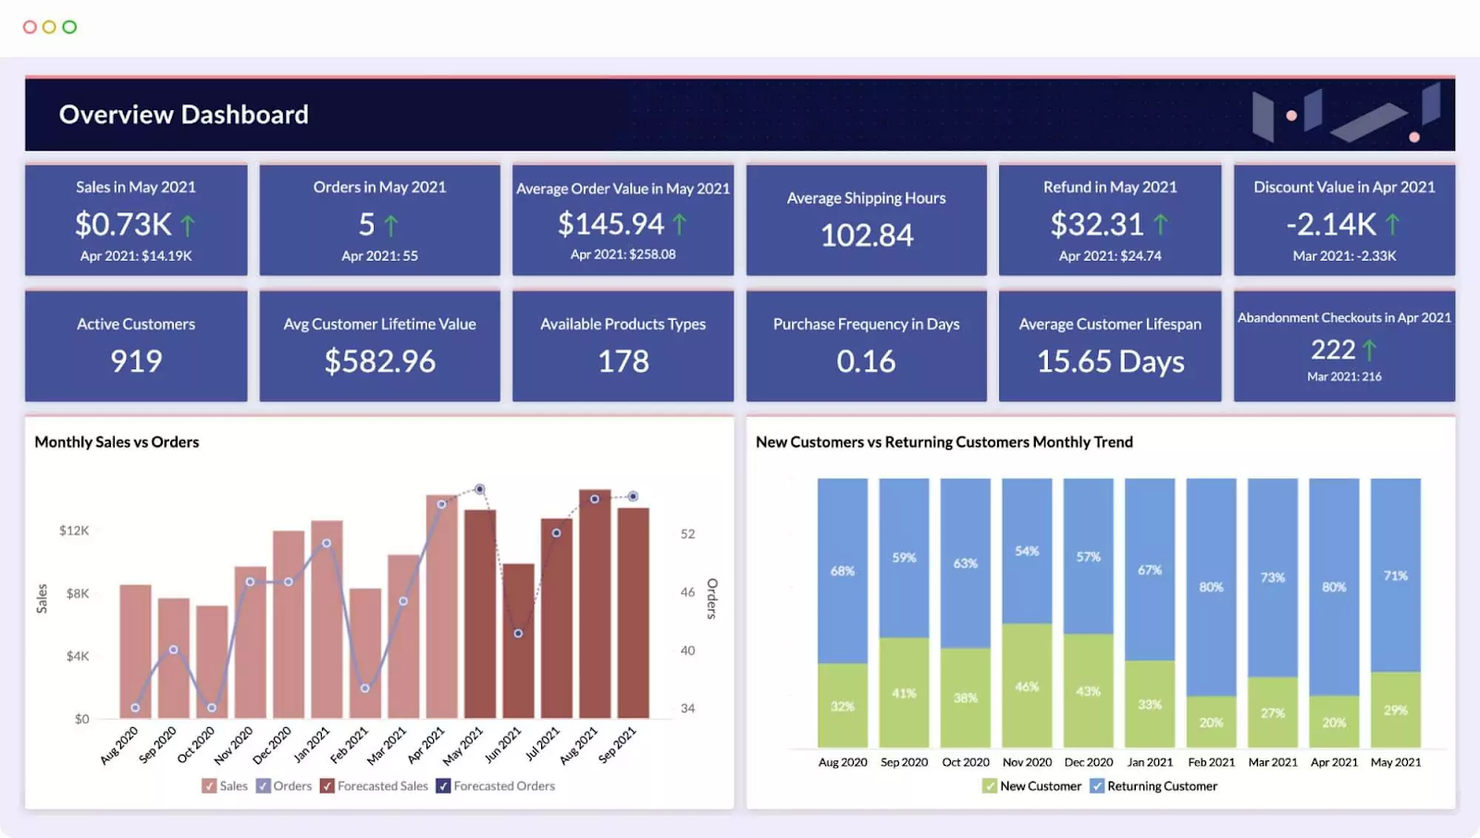
Klipfolio è una piattaforma di analytics e business intelligence che aiuta le aziende a prendere il controllo dei propri dati. La soluzione consente di personalizzare il tuo cruscotto per monitorare gli indicatori chiave di prestazione (KPI) con vari grafici e diagrammi contemporaneamente.
Klipfolio permette ai membri del tuo team di collaborare lasciando note direttamente sui grafici. I clienti possono porre domande sui grafici di riferimento, così puoi fornire risposte dettagliate.
Klipfolio si integra con decine di soluzioni, tra cui Google Analytics, ActiveCampaign, Ahrefs, Adobe Analytics, Basecamp, Dropbox, Harvest e HubSpot.
Klipfolio ha un costo a partire da $99/mese. Il software offre anche una prova gratuita di 14 giorni.
Sisense è una soluzione di BI che aiuta gli sviluppatori di prodotto a creare soluzioni su misura per i loro clienti. Lo strumento consente agli sviluppatori di realizzare analisi con marchio personalizzato e integrarle nei propri prodotti o servizi.
Il punto di forza di questa soluzione è che permette di offrire esperienze di brand coerenti. Anche se la piattaforma di analytics incorporata nel prodotto del cliente si basa sull’architettura e sulle capacità di machine learning di Sisense, puoi personalizzarne l’aspetto in base al tuo brand.
Sisense si integra con molteplici soluzioni, tra cui Google Ads, Facebook Insights, SAP Analytics Cloud, Dropbox, GitHub, Oracle BI e Google Search Console.
Sisense offre prezzi personalizzati su richiesta, oltre a una prova gratuita.
Grow è uno strumento di BI moderno che ti aiuta a prendere decisioni aziendali informate. Il software è altamente personalizzabile e ti permette di monitorare e manipolare i dati per scoprire preziosi approfondimenti. La soluzione offre diversi modelli predefiniti che ti consentono di trasformare dati grezzi in report strutturati e facili da comprendere.
I dashboard Leaderboard di Grow ti permettono di monitorare l'efficienza dei diversi team o membri del team. Questi dashboard ti aiutano a capire quali reparti o membri della tua organizzazione sono in testa per vendite o altre metriche basate su criteri personalizzati.
Grow si integra con decine di soluzioni popolari, tra cui ActiveCampaign, Airtable, Asana, Box, FreshBooks, Google Ads, HubSpot, Salesforce e Shopify.
Grow offre prezzi personalizzati su richiesta. Il software offre anche una prova gratuita su richiesta.
ClicData
Semplifica i processi di reportistica ricorrente con l'automazione

ClicData è una soluzione BI cloud-based che rende semplice monitorare i dati e interpretarli grazie a dashboard interattive. Lo strumento permette di collaborare con i membri del team e creare report che offrono approfondimenti sulle tue attività.
Una delle cose che ho apprezzato di ClicData è la possibilità di programmare report automatici e condividerli con il tuo team e collaboratori esterni tramite email. Questo ti aiuta a risparmiare tempo nella preparazione dei report ricorrenti. Inoltre, puoi accedere a ClicData direttamente dal browser e la soluzione è compatibile con i dispositivi mobili, così puoi consultare i tuoi dati ovunque ti trovi.
ClicData si integra con decine di soluzioni, fra cui Google Analytics, Bing Ads, QuickBooks, SurveyMonkey, WooCommerce e Basecamp.
ClicData ha un costo a partire da $75/mese. Il software offre anche una prova gratuita di 15 giorni.
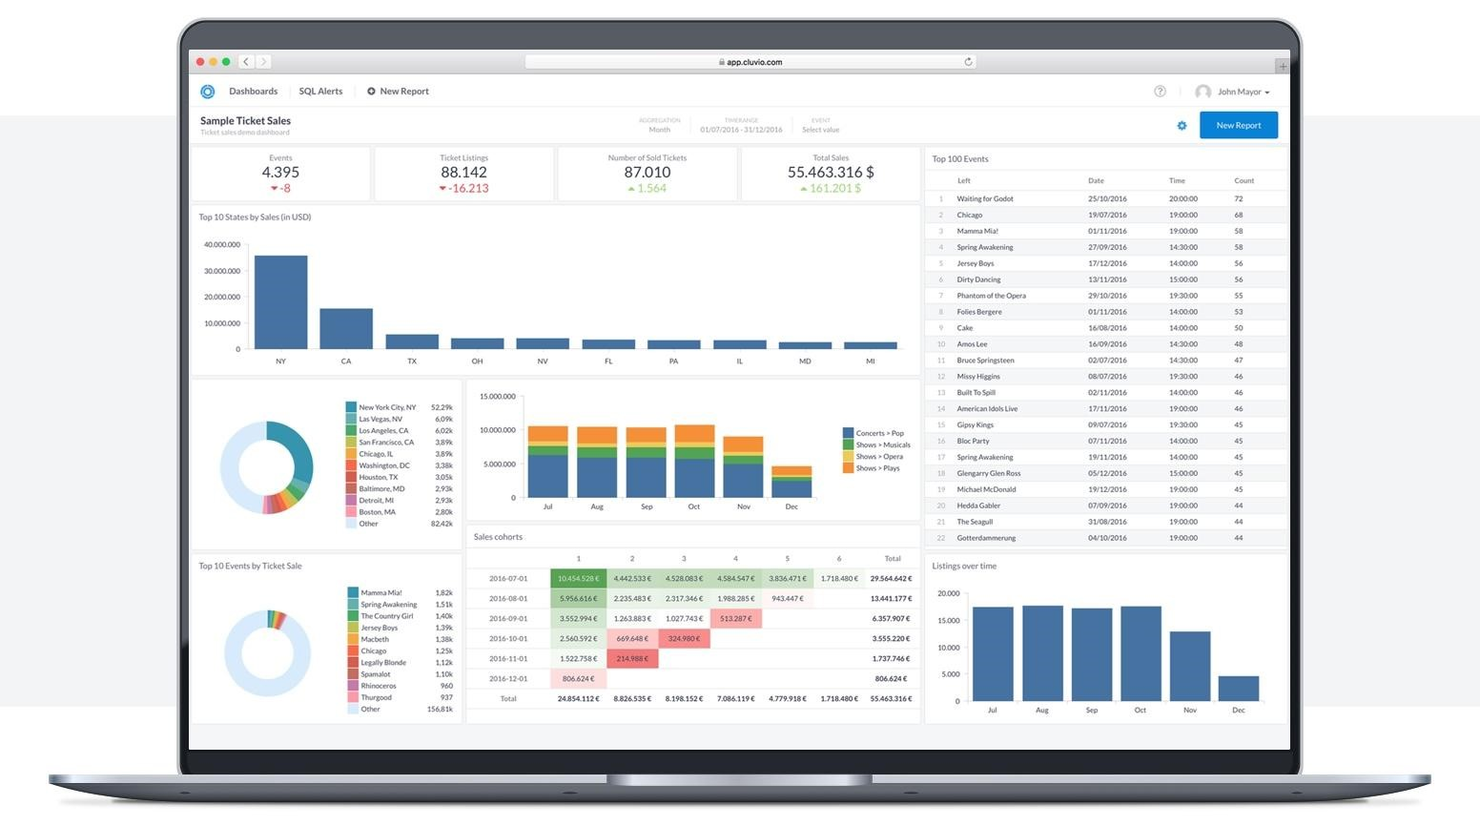
Cluvio è una soluzione di BI e analisi basata su cloud che consente ai team e alle aziende orientate ai dati di trovare approfondimenti utili utilizzando SQL e R. La soluzione ti aiuta a monitorare i KPI in tempo reale con dashboard interattive.
Questo software è stato inserito nella lista grazie alla varietà di grafici e diagrammi disponibili. Con Cluvio puoi trasformare dati non strutturati in storie guidate dai dati e aiutare i tuoi clienti a capire cosa succede nelle loro organizzazioni. Lo strumento consente di condividere dashboard con collaboratori tramite link sicuri, permettendo loro di visualizzare dashboard e report senza poterli modificare.
Cluvio si integra con decine di strumenti, inclusi Google Cloud, Google Big Query, MySQL, PostgreSQL, Amazon Redshift e Amazon Web Services.
Cluvio parte da $249/mese. Il software offre anche una prova gratuita di 14 giorni.

Athenic è una piattaforma di business intelligence alimentata dall'IA, progettata per semplificare l'analisi dei dati e migliorare il processo decisionale. Lo strumento consente ai team di interagire con i propri dati tramite query conversazionali, visualizzare immediatamente gli insight e sfruttare un potente knowledge graph per risposte strutturate e accurate. Le sue capacità di ricerca approfondita Agentic permettono un'esplorazione dettagliata dei dati, aiutando le organizzazioni a scoprire schemi e prendere decisioni informate più rapidamente.
Il punto di forza di Athenic è l'approccio guidato dall'IA all'interazione con i dati. Con l'intelligenza artificiale conversazionale e modelli linguistici personalizzabili, i team possono porre domande in modo naturale e generare visualizzazioni in pochi secondi. Questo rende Athenic particolarmente utile per le organizzazioni che desiderano aumentare l'adozione della BI e la collaborazione, supportando sia startup che grandi imprese.
Athenic si integra con molteplici soluzioni, tra cui Notion, Stripe, AWeber, Asana, Google Calendar, Database SQL, Data Warehouse, CRM, ERP, piattaforme di marketing, SDK Python e REST API.
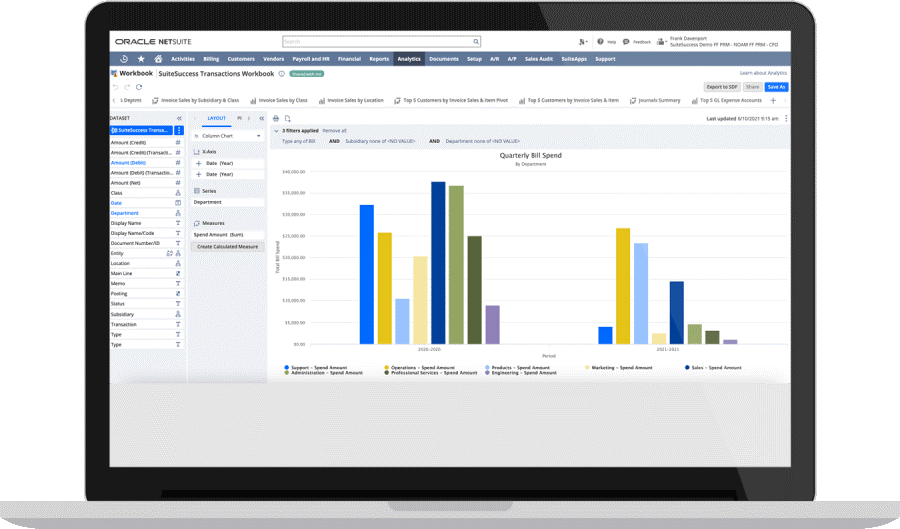
NetSuite SuiteAnalytics è un software di business intelligence che aiuta le aziende a prendere decisioni migliori permettendo loro di interpretare i big data. La soluzione è versatile e flessibile, ma presenta una certa curva di apprendimento se non hai familiarità con l’ecosistema di applicazioni di NetSuite.
NetSuite SuiteAnalytics raccoglie dati da molteplici fonti e ti aiuta a comprendere cosa sta succedendo nella tua organizzazione grazie a ricerche in tempo reale, al monitoraggio dei KPI e a ottime funzionalità di reportistica. Puoi personalizzare i tuoi report e creare modelli di report che includono formule specifiche per la tua attività, così da risparmiare tempo nel lungo periodo.
NetSuite SuiteAnalytics si integra con decine di strumenti tramite integratori di terze parti come Zapier.
NetSuite SuiteAnalytics offre prezzi personalizzati su richiesta, oltre a una demo gratuita.
Altri Software di Business Intelligence
Ecco alcune altre opzioni che non sono entrate nella lista dei migliori software di business intelligence:
- SAP BusinessObjects
Pianifica il futuro con le funzioni di previsione
- Microsoft Power BI
Combina più visualizzazioni per creare report completi
- Phocas
Scomponi i tuoi dati finanziari e crea report semplici e chiari
- Metric Insights
Tieni traccia dei tuoi dati con una soluzione BI mobile
- bipp Analytics
Dotate le vostre applicazioni web di funzionalità di reportistica grazie a una soluzione BI integrata


Come Valuto i Software di Business Intelligence
La mia valutazione si suddivide in due livelli: la base—connessione a Workday e alimentazione di dashboard sull’attrito—e i fattori differenzianti che distinguono i BI tool per l’HR.
Funzionalità di Base (Requisiti Minimi per Questa Lista)
Quando seleziono gli strumenti per la mia lista, valuto ciascuno su una scala da 0 (non offre la funzionalità) a 5 (eccelle in quest’area) per ogni funzionalità di base elencata di seguito. Successivamente, calcolo il punteggio totale dello strumento in percentuale. Ogni tool deve raggiungere un punteggio totale minimo del 65% per essere considerato.
- Integrazione Dati & Connettori: Verifico se la piattaforma si connette in modo nativo a sistemi HR comuni come Workday, BambooHR o ADP, oltre che a database generali e data warehouse cloud.
- Dashboard Interattivi & Visualizzazioni: Drill-down, filtri incrociati e varietà di grafici sono importanti qui—valuto quanto sia facile esplorare le tendenze sulla forza lavoro o il turnover per dipartimento.
- Reportistica Self-Service & Query Ad Hoc: I team HR devono poter estrarre autonomamente i report senza attendere il supporto IT, quindi valuto builder drag-and-drop e strumenti di query guidata.
- Analisi Predittiva & Previsioni: Cerco funzioni integrate di forecast—come punteggi di rischio di attrito o modelli di domanda della forza lavoro—oltre alle semplici linee di tendenza su un grafico.
- Data Modeling & Trasformazione: Definire metriche riutilizzabili come costo-per-assunzione o span of control richiede un layer semantico o campi calcolati; quindi valuto come ogni strumento gestisce questi aspetti.
- Condivisione, Pianificazione & Permessi: L’accesso basato sui ruoli è essenziale quando le dashboard contengono dati sensibili come le retribuzioni o dati personali identificabili; perciò controllo la presenza di sicurezza a livello di riga e distribuzione pianificata.
Una volta che dispongo di una lista di strumenti che soddisfano questi criteri, considero cosa rende ogni piattaforma unica.
Fattori Differenzianti (Cosa Distingue i Fornitori)
Ecco come confronto e metto a paragone i diversi fornitori:
Funzionalità di Spicco
I dashboard HR preconfigurati fanno davvero la differenza per i team people ops che hanno bisogno di visualizzare subito dati su turnover o DEI senza partire da zero. Anche la query in linguaggio naturale è una funzionalità che valuto attentamente—permette a un responsabile HR di digitare "qual è il nostro tasso di attrito per dipartimento?" e ottenere subito un grafico. Considero inoltre gli analytics integrati, perché portare i dati sul personale direttamente dentro il proprio HRIS favorisce un reale utilizzo da parte dei manager.
Oltre le Funzionalità
Conformità e sicurezza dei dati pesano molto quando i dashboard riportano fasce salariali o valutazioni delle performance. Verifico la certificazione SOC 2 Type II, il supporto SSO e la sicurezza a livello di riga che limita i manager ai soli dati dei loro riporti diretti. La trasparenza dei prezzi è fondamentale—valuto se le licenze crescono in modo ragionevole passando da un piccolo team HR analytics a un’implementazione aziendale. Infine, considero i tempi di implementazione e le risorse per l’onboarding, perché uno strumento che richiede sei mesi per essere avviato può bloccare un’iniziativa di workforce planning.
Come Scegliere un Software di Business Intelligence
È facile perdersi in lunghe liste di funzionalità e strutture di prezzo complesse. Per aiutarti a restare concentrato durante il tuo processo di selezione, ecco una checklist di fattori da considerare:
| Fattore | Cosa Considerare |
|---|---|
| Scalabilità | Il software può crescere con la tua azienda? Valuta se supporta l’aumento dei volumi di dati e degli utenti senza perdere prestazioni. |
| Integrazioni | Assicurati che si connetta ai tuoi sistemi esistenti come CRM o ERP. Verifica se ci sono limitazioni o costi aggiuntivi per le integrazioni. |
| Personalizzazione | Permette di adattare dashboard e report alle tue esigenze? Fai attenzione a strumenti che offrono opzioni di personalizzazione limitate. |
| Facilità d’uso | L’interfaccia è intuitiva per il tuo team? Evita strumenti con una curva di apprendimento ripida che richiedono formazione estesa. |
| Implementazione e onboarding | Quanto tempo serve per l’implementazione? Cerca soluzioni con un processo di onboarding chiaro, incluse risorse formative e supporto. |
| Costo | Ci sono costi nascosti? Confronta i modelli di prezzo e assicurati di capire cosa è incluso nel prezzo base e cosa si paga come extra. |
| Sicurezza | Valuta le misure di protezione dei dati. È conforme a standard come GDPR o ISO 27001? |
| Disponibilità del supporto | Che tipo di supporto offre il fornitore? Verifica la presenza di supporto 24/7 e la disponibilità di più canali come chat, email e telefono. |
Che Cos’è un Software di Business Intelligence?
Il software di business intelligence è uno strumento che aiuta le organizzazioni ad analizzare i dati per prendere decisioni informate. Professionisti come analisti di dati, manager e dirigenti utilizzano questi strumenti per acquisire insight e migliorare le strategie aziendali. La visualizzazione dei dati, la reportistica e le capacità di integrazione facilitano la comprensione delle tendenze, l'identificazione di opportunità e l'ottimizzazione delle operazioni. Questi strumenti offrono agli utenti informazioni chiare e azionabili, migliorando i processi decisionali.
Funzionalità
Quando si seleziona un software di business intelligence, presta attenzione alle seguenti caratteristiche chiave:
- Visualizzazione dei dati: Trasforma set di dati complessi in formati visivi facili da comprendere, aiutando gli utenti a cogliere rapidamente gli insight.
- Creazione di dashboard: Permette agli utenti di costruire dashboard personalizzate per monitorare in tempo reale i principali indicatori e tendenze.
- Reportistica e analisi: Fornisce report dettagliati e analisi a supporto di decisioni guidate dai dati.
- Capacità di integrazione: Si connette con sistemi esistenti come CRM ed ERP per un flusso dati senza interruzioni e un'analisi completa.
- Accesso ai dati in tempo reale: Offre informazioni aggiornate, consentendo risposte tempestive ai cambiamenti delle condizioni aziendali.
- Analisi predittiva: Utilizza dati storici per prevedere tendenze e risultati futuri, supportando una pianificazione proattiva.
- Avvisi personalizzabili: Notifica agli utenti variazioni significative o anomalie nei dati, tenendoli aggiornati sugli sviluppi critici.
- Accessibilità mobile: Assicura che gli utenti possano accedere a dati e insight da qualsiasi luogo, aumentando flessibilità e reattività.
- Salvaguardie di sicurezza: Protegge i dati sensibili con misure di sicurezza standard di settore, garantendo conformità e integrità dei dati.
Vantaggi
L'implementazione di un software di business intelligence offre diversi vantaggi per il tuo team e la tua azienda. Eccone alcuni a cui puoi aspirare:
- Migliore processo decisionale: L'accesso a dati e analisi in tempo reale aiuta gli utenti a prendere decisioni informate rapidamente.
- Maggiore accuratezza dei dati: Le capacità di integrazione garantiscono la coerenza dei dati tra i sistemi, riducendo errori e discrepanze.
- Aumento dell'efficienza: Reportistica automatizzata e avvisi personalizzabili fanno risparmiare tempo riducendo le attività manuali di elaborazione dei dati.
- Migliore pianificazione strategica: Le analisi predittive forniscono insight sulle tendenze future, supportando la pianificazione e la previsione a lungo termine.
- Maggiore trasparenza: Dashboard e visualizzazione dei dati facilitano la condivisione di insight e risultati con gli stakeholder.
- Flessibilità e mobilità: L'accessibilità mobile permette agli utenti di accedere ai dati e agli insight importanti anche in movimento.
- Potenziata sicurezza dei dati: Le salvaguardie di sicurezza proteggono le informazioni sensibili, garantendo la conformità agli standard di protezione dei dati.
Costi e Prezzi
La scelta di un software di business intelligence richiede la comprensione dei vari modelli e piani di prezzo disponibili. I costi variano in base alle funzionalità, alla dimensione del team, ai componenti aggiuntivi e altro ancora. La tabella seguente riassume i piani comuni, i relativi prezzi medi e le funzionalità tipiche incluse nelle soluzioni software di business intelligence:
Tabella di Confronto dei Piani per Software di Business Intelligence
| Tipologia Piano | Prezzo Medio | Funzionalità Comuni |
|---|---|---|
| Piano Gratuito | $0 | Reportistica di base, sorgenti dati limitate e supporto della community. |
| Piano Personale | $5-$25/user/month | Analisi ad hoc, visualizzazione dei dati e supporto tramite e-mail. |
| Piano Business | $30-$60/user/month | Analisi avanzate, creazione di dashboard e integrazione con altri strumenti. |
| Piano Enterprise | $100+/user/month | Soluzioni personalizzabili, sicurezza avanzata, supporto dedicato e analisi complete. |
FAQ
Qual è la differenza tra software BI e strumenti di analisi dei dati?
Il software BI si concentra sul fornire approfondimenti e visualizzazioni a partire da dati storici per supportare i processi decisionali. Gli strumenti di analisi dei dati, invece, spesso includono funzionalità di analisi predittiva e modelli di dati più complessi. Se desideri comprendere le prestazioni passate e prendere decisioni consapevoli, il software BI è una scelta adatta. Per capacità predittive, considera di integrare strumenti di analisi dei dati.
Quanto tempo richiede l’implementazione di un software BI?
Il tempo di implementazione varia a seconda della complessità dello strumento e delle esigenze della tua organizzazione. Le configurazioni semplici possono richiedere pochi giorni, mentre integrazioni più complesse potrebbero necessitare di settimane. Per accelerare il processo, assicurati di avere un piano chiaro, coinvolgere i principali stakeholder e sfruttare il supporto e le risorse di formazione offerte dal fornitore.
Ho bisogno di competenze tecniche per usare un software di business intelligence?
No, non è necessario avere particolari competenze tecniche per utilizzare un software BI. Molti strumenti sono progettati con interfacce intuitive e funzionalità di drag-and-drop per facilitarne l’uso. Tuttavia, una comprensione di base delle nozioni sui dati può essere utile. Cerca soluzioni che offrano un buon supporto e materiali di formazione a sostegno del tuo team.
E ora?
Se stai valutando soluzioni di business intelligence, rivolgiti a un consulente di SoftwareSelect per ricevere consigli gratuiti.
Compila un modulo e avrai una breve conversazione in cui verranno approfondite le tue necessità specifiche. Riceverai un elenco ristretto di software da valutare. Ti supporteranno anche durante tutto il processo di acquisto, incluse le trattative sul prezzo.