The Best and Worst States for Workplace Culture in 2026

Workplace culture is a critical factor influencing employee satisfaction, productivity, and retention. Do workers receive benefits like high salaries, paid and sick leave, access to wellness or employee assistance programs? There are a number of elements when combined make up an overall measure of how companies positively impact their workplaces.
But which U.S. states are the best and worst for it?
At PeopleManagingPeople.com, we’ve created a “Workplace Culture Index” by analyzing key data points across the United States to rank their performance. From salary growth to access to wellness programs, this data-driven analysis sheds light on where employees thrive and where there’s room for improvement.
Below, we break down the findings from our analysis of data for the last four years. Here are our key findings:
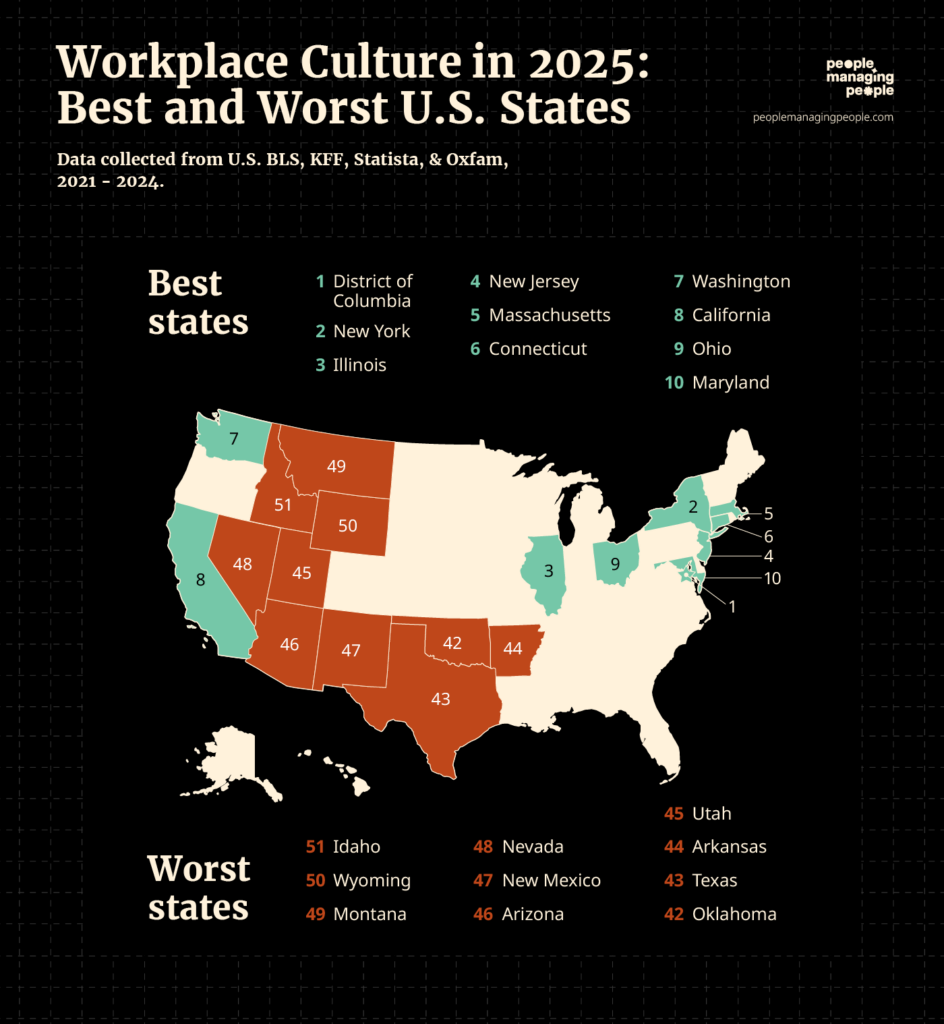
The 10 Best States for Workplace Culture
The District of Columbia has the highest Workplace Culture score
- District of Columbia
- New York
- Illinois
- New Jersey
- Massachusetts
- Connecticut
- Washington
- California
- Ohio
- Maryland
The 10 Worst States for Workplace Culture
Idaho has the lowest Workplace Culture score
- Idaho
- Wyoming
- Montana
- Nevada
- New Mexico
- Arizona
- Utah
- Arkansas
- Texas
- Oklahoma
Top Performers: The States Leading Workplace Culture
The District of Columbia secured the top spot, driven by high salaries, a low rate of individuals leaving their jobs, and comprehensive benefits. New York and Illinois make up the rest of the top 3 with both having high salary growth and strong state policies to protect workers and their wages.
Regions Struggling with Retention
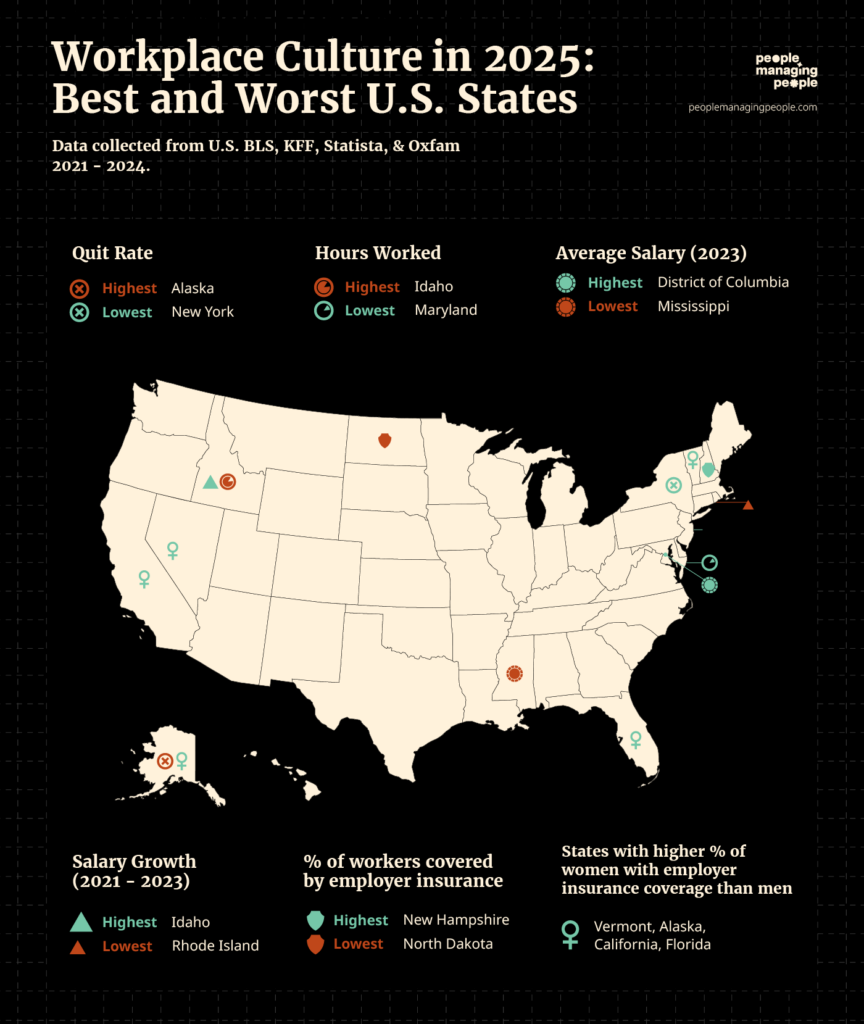
High quit rates, an indicator of dissatisfaction, were a significant challenge for many states. Alaska (3.8%), Wyoming (3.7%) and Montana (3%) had the highest quit rates across states in 2024.
States with higher quit rates also often lag in flexible work schedules and employee assistance programs.
It’s clear that providing workers with high salaries is not a guarantee they will stay in their job. Colorado has an average salary of $71,960, above the national average but a quit rate of 2.5%.
The Flexibility Divide
Flexible work options remain unevenly distributed. States like Massachusetts lead in offering paid personal and sick leave, while lagging in access to flexible workplace arrangements. States with the highest flexibility often correspond with lower commute times and better work-life balance.
Wellness Programs: A Buzzword, Not a Reality
Despite the corporate world's emphasis on wellness, the data shows that even top states like Illinois and New York offer wellness programs to barely half of employees. This exposes a gap between what companies claim to prioritize and what employees actually experience.
Salary Growth: A Critical Factor for Retention
States with notable salary growth, like Florida (16%), demonstrate the power of competitive compensation in attracting and retaining talent. However, states offering stagnant wages often see higher quit rates and lower morale.
“Mountain” States Make Up The Bottom Seven
States within this region struggle due to a lack of wellness and employee assistance programs, low levels of paid leave whether sick, vacation or personal, and more hours spent working. Idaho places last and has the highest levels of hours worked across the nation.
Colorado is the sole outlier in this region placing 36th.
Subsidized Commuting Is Nonexistent
Only 4% of employees in the South Atlantic or Pacific region have access to subsidized commuting. If even the best states are failing here, the national picture is bleak. Employers are ignoring an easy win to reduce commute stress and improve satisfaction.
Employer Insurance Covers Men More Than Women
The percentage of workers reporting they have insurance through their jobs showed that a higher proportion of men have coverage than women. Only four states showed more women reporting they have employer insurance than men: Vermont, Alaska, California, & Florida.
Conclusion
Our analysis highlights a clear message: workplace culture is multifaceted. While some states excel in salaries, others shine in flexibility or wellness initiatives. The best workplace cultures balance these elements, creating environments where employees feel valued and supported.
We believe that the future of work depends on continuous improvement in these areas. By fostering inclusive, flexible, and well-supported workplaces, organizations can attract top talent and set new standards for employee satisfaction.
Improving workplace culture within your own organization can be impacted by implementing tools such as performance management software to better measure and provide feedback on the performance of your employees.
If you’re a global business, an employer of record will manage all elements of your HR processes and ensure they comply with local regulations where your employees are based.
Methodology
To rank each U.S. state we collected data from the U.S. Bureau of Labor Statistics, KFF, Statista and Oxfam from 2021 to 2024.
The below metrics were normalized to a consistent scale (0 to 1) using Min-Max Scaling to ensure comparability across states and years.
A weighted composite score was created using a weighting for each metric, based on our knowledge of the importance of each to workplace culture. The 24 metrics selected and their weights were:
- Quit rate (-15%, the lower the rate the better)
- U.S. BLS Hours Worked Index (-20%, the lower the hours the better)
- Salary Growth from 2021 to 2023 (10%)
- Average Salary 2023 (25%)
- Average annual USD premiums for employer-sponsored family health insurance plans in 2023 (-2.5%, the lower the premium the better)
- “Employer insurance” coverage rate (10%)
- Score of State policies to protect wages, analyzed by Oxfam (5%)
- Score of State policies for worker protection, analyzed by Oxfam (5%)
- Score of State policies to protect workers right to organize, analyzed by Oxfam (5%)
- Paid holidays: average number of days* (5%)
- Percentage of workers reporting access to all retirement benefits* (5%)
- Percentage of workers reporting access to childcare* (2.5%)
- Percentage of workers reporting access to dental care benefits* (2.5%)
- Percentage of workers reporting access to vision care benefits* (2.5%)
- Percentage of workers reporting access to wellness programs* (2.5%)
- Percentage of workers reporting access to medical care benefits* (5%)
- Percentage of workers reporting access to employee assistance programs* (5%)
- Percentage of workers reporting access to flexible work schedule* (5%)
- Percentage of workers reporting access to flexible workplace* (5%)
- Percentage of workers reporting access to life insurance plans* (5%)
- Percentage of workers reporting access to paid personal leave* (2.5%)
- Percentage of workers reporting access to paid sick leave* (5%)
- Percentage of workers reporting access to paid vacation* (5%)
- Percentage of workers reporting access to subsidized commuting* (2.5%)
*The data collected for these metrics were from the U.S. BLS surveys based on their Census area of New England, Mid-Atlantic, East North Central, West North Central, South Atlantic, East South Central, West South Central, Mountain, and Pacific. As this data was not on a state level, these metrics were given a lower weighting within the index.
These scores were used to rank each state, highlighting their strengths in average compensation and growth, employee benefits, wage and worker protections, and lower job quit rates.
The Data
| Rank | State | Workplace Culture Score | 2024 Quit rate (%) | Hours Worked Index | Salary Growth (2021-2023) | Average USD Salary (2023) |
| 1 | District of Columbia | 0.731 | 1.7 | 96.5 | 7.9% | 106,230 |
| 2 | New York | 0.713 | 1.4 | 101.1 | 11.6% | 78,620 |
| 3 | Illinois | 0.684 | 1.6 | 99.1 | 12.5% | 67,130 |
| 4 | New Jersey | 0.648 | 1.5 | 105 | 10.2% | 73,980 |
| 5 | Massachusetts | 0.637 | 1.5 | 101.8 | 10.1% | 80,330 |
| 6 | Connecticut | 0.608 | 1.6 | 101.3 | 11.5% | 73,740 |
| 7 | Washington | 0.600 | 1.8 | 105.9 | 13.7% | 78,130 |
| 8 | California | 0.596 | 1.7 | 102.6 | 12.3% | 76,960 |
| 9 | Ohio | 0.579 | 2.0 | 100.4 | 12.6% | 59,890 |
| 10 | Maryland | 0.571 | 2.0 | 96.2 | 11.7% | 73,620 |
| 11 | Pennsylvania | 0.569 | 1.7 | 102.6 | 11.6% | 61,920 |
| 12 | Vermont | 0.564 | 2.3 | 96.8 | 13.2% | 62,780 |
| 13 | Wisconsin | 0.564 | 1.9 | 98.8 | 12.0% | 59,500 |
| 14 | Minnesota | 0.559 | 1.9 | 100.5 | 10.3% | 66,700 |
| 15 | New Hampshire | 0.555 | 1.5 | 102.2 | 11.5% | 66,110 |
| 16 | Oregon | 0.533 | 2.2 | 103.9 | 12.9% | 66,710 |
| 17 | Maine | 0.530 | 1.8 | 101 | 12.7% | 60,000 |
| 18 | Michigan | 0.529 | 2.0 | 100.5 | 9.9% | 60,600 |
| 19 | Hawaii | 0.522 | 2.0 | 100.3 | 8.8% | 65,030 |
| 20 | Nebraska | 0.512 | 2.0 | 97.3 | 11.5% | 58,080 |
| 21 | Rhode Island | 0.472 | 1.8 | 105.3 | 7.2% | 66,610 |
| 22 | Kansas | 0.467 | 1.8 | 100.6 | 13.3% | 56,270 |
| 23 | Missouri | 0.458 | 2.1 | 102.6 | 12.1% | 57,580 |
| 24 | Indiana | 0.456 | 2.7 | 102.7 | 11.9% | 56,420 |
| 25 | Virginia | 0.448 | 2.2 | 104.3 | 12.4% | 70,050 |
| 26 | North Dakota | 0.443 | 2.1 | 101.5 | 10.6% | 59,050 |
| 27 | Iowa | 0.420 | 2.0 | 101.5 | 10.3% | 56,400 |
| 28 | South Dakota | 0.416 | 2.1 | 106.3 | 13.7% | 53,230 |
| 29 | Kentucky | 0.399 | 2.2 | 105.3 | 12.2% | 54,030 |
| 30 | Tennessee | 0.396 | 2.3 | 107.8 | 13.6% | 56,030 |
| 31 | Delaware | 0.394 | 2.5 | 105.9 | 10.3% | 65,990 |
| 32 | Alabama | 0.386 | 2.4 | 104.5 | 11.0% | 53,400 |
| 33 | Mississippi | 0.366 | 2.3 | 102.1 | 11.4% | 47,570 |
| 34 | Alaska | 0.355 | 3.8 | 99.0 | 10.1% | 69,880 |
| 35 | West Virginia | 0.302 | 2.8 | 99.5 | 12.3% | 52,200 |
| 36 | Colorado | 0.294 | 2.5 | 108.5 | 14.4% | 71,960 |
| 37 | Florida | 0.290 | 2.5 | 113.9 | 15.9% | 60,210 |
| 38 | Georgia | 0.288 | 2.2 | 109.7 | 13.6% | 61,250 |
| 39 | North Carolina | 0.278 | 1.9 | 111.1 | 12.5% | 59,730 |
| 40 | Louisiana | 0.274 | 2.3 | 100.3 | 11.9% | 53,440 |
| 41 | South Carolina | 0.253 | 2.4 | 111.3 | 14.2% | 54,250 |
| 42 | Oklahoma | 0.249 | 2.4 | 102.9 | 10.5% | 53,450 |
| 43 | Texas | 0.232 | 1.8 | 114.4 | 12.9% | 61,240 |
| 44 | Arkansas | 0.195 | 2.2 | 108.8 | 10.2% | 51,250 |
| 45 | Utah | 0.179 | 2.0 | 112.5 | 14.4% | 61,070 |
| 46 | Arizona | 0.176 | 1.8 | 116.5 | 14.3% | 63,040 |
| 47 | New Mexico | 0.139 | 2.2 | 106.4 | 10.9% | 57,520 |
| 48 | Nevada | 0.139 | 2.3 | 118.3 | 15.3% | 58,900 |
| 49 | Montana | 0.064 | 3.0 | 113.6 | 13.3% | 55,920 |
| 50 | Wyoming | 0.062 | 3.7 | 103.5 | 11.2% | 57,930 |
| 51 | Idaho | 0.052 | 2.7 | 119.1 | 16.1% | 55,640 |