20 Best Business Intelligence Tools of 2026

10 Best Business Intelligence Software Shortlist
Here's my pick of the 10 best software from the 20 tools reviewed.


Navigating the complexities of HR can be overwhelming. You’re juggling data, employee needs, and strategic goals. Business intelligence software can ease these burdens, turning chaos into clarity.
In my experience, the right tools provide insights that empower your team to make informed decisions. You’ll find solutions that address your unique challenges, from analyzing workforce trends to optimizing resource allocation.
I’ve independently tested and reviewed the top business intelligence software on the market. This listicle will give you an unbiased look at the best options available, focusing on features that matter most to your team.
Why Trust Our Software Reviews
Best Business Intelligence Software Summary
This comparison chart summarizes pricing details for my top business intelligence software selections to help you find the best one for your budget and business needs.
| Tool | Best For | Trial Info | Price | ||
|---|---|---|---|---|---|
| 1 | Best for interactive spreadsheet reporting | Free plan available | From $49/month (billed annually) | Website | |
| 2 | Augment your data and predict future trends | 15-day free trial + free plan + free demo available | From $48/2 users/month (billed annually) | Website | |
| 3 | Create dashboards and answer client questions on the same platform | 14-day free trial available | From $120/month (billed annually) | Website | |
| 4 | Create white-labeled analytics experiences | 7-day free trial + free demo available | From $399/month | Website | |
| 5 | Track the efficiency of your departments or team members | Free demo available | Pricing upon request | Website | |
| 6 | Best for turning data into AI-driven insights | Free demo available | Pricing upon request | Website | |
| 7 | Save time with custom report templates | Free demo available | Pricing upon request | Website | |
| 8 | Plan for the future with forecasting features | Free demo available | Pricing upon request | Website | |
| 9 | Combine multiple visualizations to create comprehensive reports | Free plan available | From $14/user/month (billed annually) | Website | |
| 10 | Simplify recurring reporting tasks with automation | 15-day free trial | From $75/month | Website |
-

Checkr
Visit WebsiteThis is an aggregated rating for this tool including ratings from Crozdesk users and ratings from other sites.4.5 -
Kudoboard
Visit WebsiteThis is an aggregated rating for this tool including ratings from Crozdesk users and ratings from other sites.4.8 -
Native Teams
Visit WebsiteThis is an aggregated rating for this tool including ratings from Crozdesk users and ratings from other sites.4.9


Best Business Intelligence Software Systems
Here’s a brief description of each business intelligence software system to showcase each tool’s best use case, plus some noteworthy features, and screenshots to give you a snapshot of the user interface.
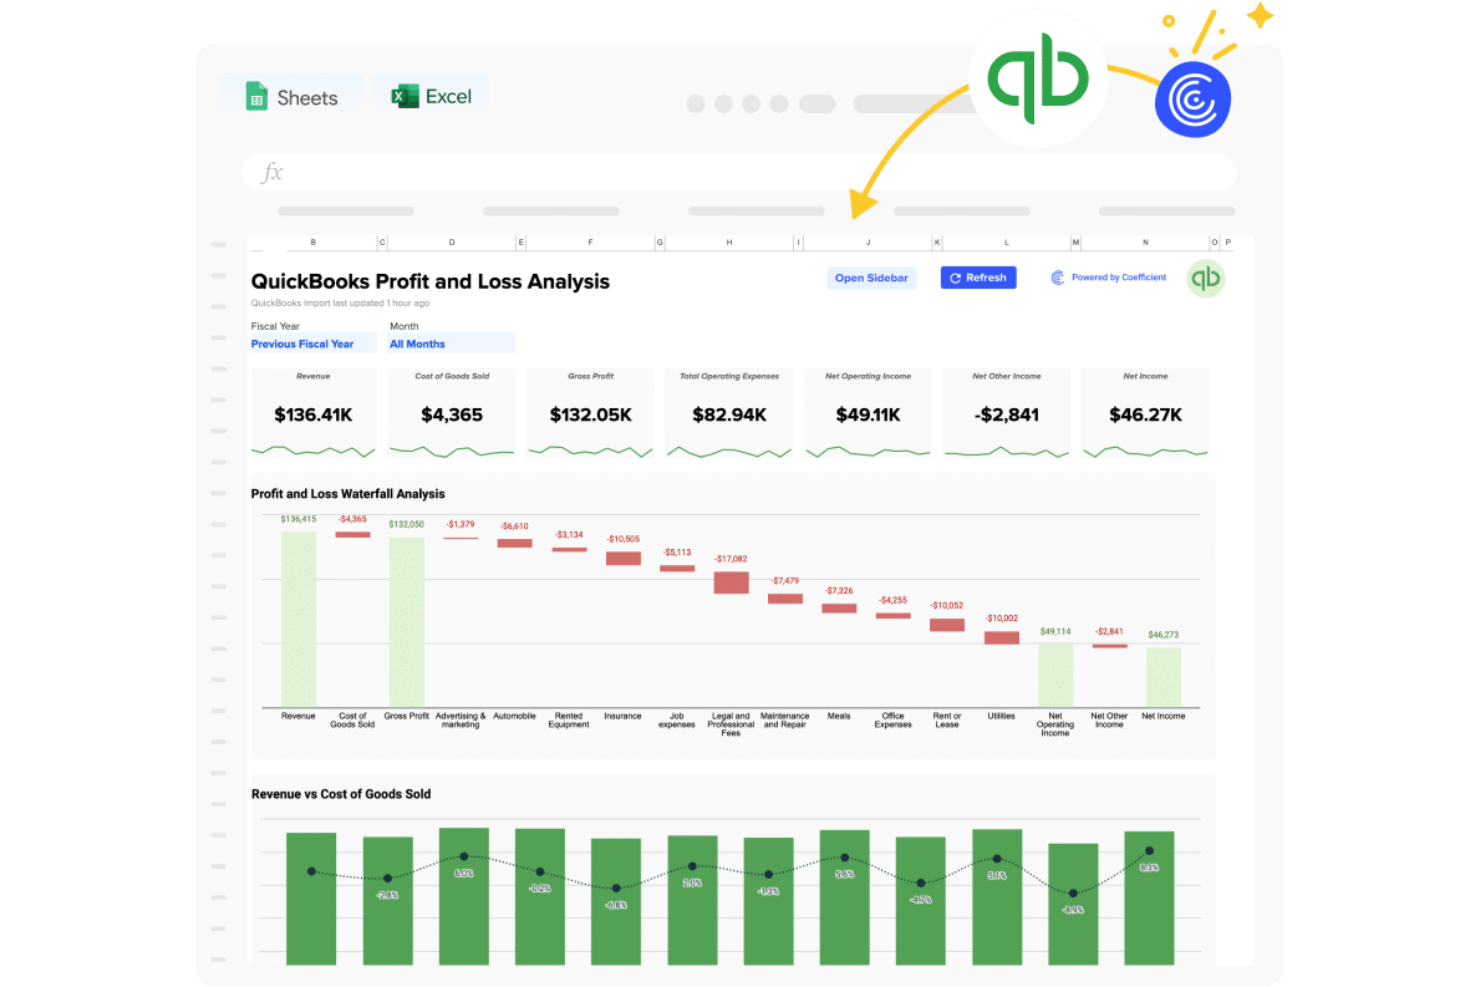
For businesses seeking a dynamic business intelligence software solution, Coefficient offers an innovative approach by transforming spreadsheets into powerful data applications without the need for coding. This tool is particularly appealing to professionals in finance, marketing, and revenue operations who are looking to simplify their data management and reporting processes. With Coefficient, you can tackle the challenges of real-time data access and automated reporting, empowering your team to make informed decisions swiftly.
Why I Picked Coefficient
I picked Coefficient because it excels in transforming traditional spreadsheets into interactive data applications, a unique selling point in the realm of business intelligence software. Its feature of live data analysis allows you to connect to over 100 data sources, providing real-time insights that are crucial for timely decision-making. Additionally, the AI-driven dashboards offer a sophisticated way to visualize complex data sets, enabling your team to identify trends and patterns effortlessly. This combination of features addresses the need for streamlined data workflows and enhanced productivity.
Coefficient Key Features
In addition to its unique capabilities, I also found other valuable features:
- Automated Reporting: The tool automates the reporting process, saving your team time and reducing the risk of human error.
- Data Transformation Tools: Coefficient provides robust tools for data cleaning and transformation, ensuring that your data is always accurate and actionable.
- AI-Driven Dashboards: These dashboards offer advanced visualization options, helping you to interpret complex data with ease.
- Prebuilt Connectors: With over 100 prebuilt connectors, Coefficient allows seamless integration with various data sources, expanding your data access capabilities.
Coefficient Integrations
Integrations include Salesforce, QuickBooks, Snowflake, Tableau, HubSpot, MySQL, Redshift, Looker, Google Sheets, and Excel.
Pros and Cons
Pros:
- Enables customizable alerts via Slack and Email
- One-click integration to 100+ pre-built connectors
- Supports real-time spreadsheet reporting workflows
Cons:
- Some pre-built connectors like BigQuery, Sage Intacct are available only on enterprise plan
- Free plan usage limits can be restrictive for some businesses

Zoho Analytics is a business intelligence (BI) tool that helps organizations collect and track data. The software pulls data from multiple sources and organizes it into clean dashboards, allowing you to slice and dice the information however you want.
With Zoho Analytics, you can track key business metrics to identify behavioral trends. The software’s AI-driven management module helps you augment your data so you can predict future trends and generate insights.
Zoho Analytics integrates with hundreds of popular apps, including Salesforce, Google Drive, QuickBooks, Zendesk, HubSpot, and Mailchimp.
Zoho Analytics costs from $24/month. The software also offers a 15-day free trial.
New Product Updates from Zoho Analytics

Zoho Analytics Enhances Analysis, Reporting, and Real-Time Data
Zoho Analytics brings richer PDF exports, smarter multi-table auto analysis, and real-time data connections. These updates help teams generate deeper insights, preserve report accuracy, and analyze data in real time with less manual effort. For more information, visit Zoho Analytics’ official site.
 .
.Create dashboards and answer client questions on the same platform

Klipfolio is an analytics and BI platform that helps businesses take control of their data. The solution enables you to customize your dashboard to track KPIs with multiple charts and graphs at a time.
Klipfolio allows your team members to collaborate by leaving each other notes directly on the charts. Clients can ask questions on the charts they’re referencing, so you can provide detailed answers.
Klipfolio integrates with dozens of solutions, including Google Analytics, ActiveCampaign, Ahrefs, Adobe Analytics, Basecamp, Dropbox, Harvest, and HubSpot.
Klipfolio costs from $99/month. The software also offers a 14-day free trial.

Sisense is a BI solution that helps product developers create bespoke solutions for their clients. The tool allows developers to create white-labeled analytics and integrate them into their products or services.
The highlight of this solution is that it enables you to deliver consistent brand experiences. Even though the analytics platform you embed into your client’s product relies on Sisense’s architecture and machine learning capabilities, you can customize its look and feel to your brand.
Sisense integrates with multiple solutions, including Google Ads, Facebook Insights, SAP Analytics Cloud, Dropbox, GitHub, Oracle BI, and Google Search Console.
Sisense offers custom pricing upon request, as well as a free trial.
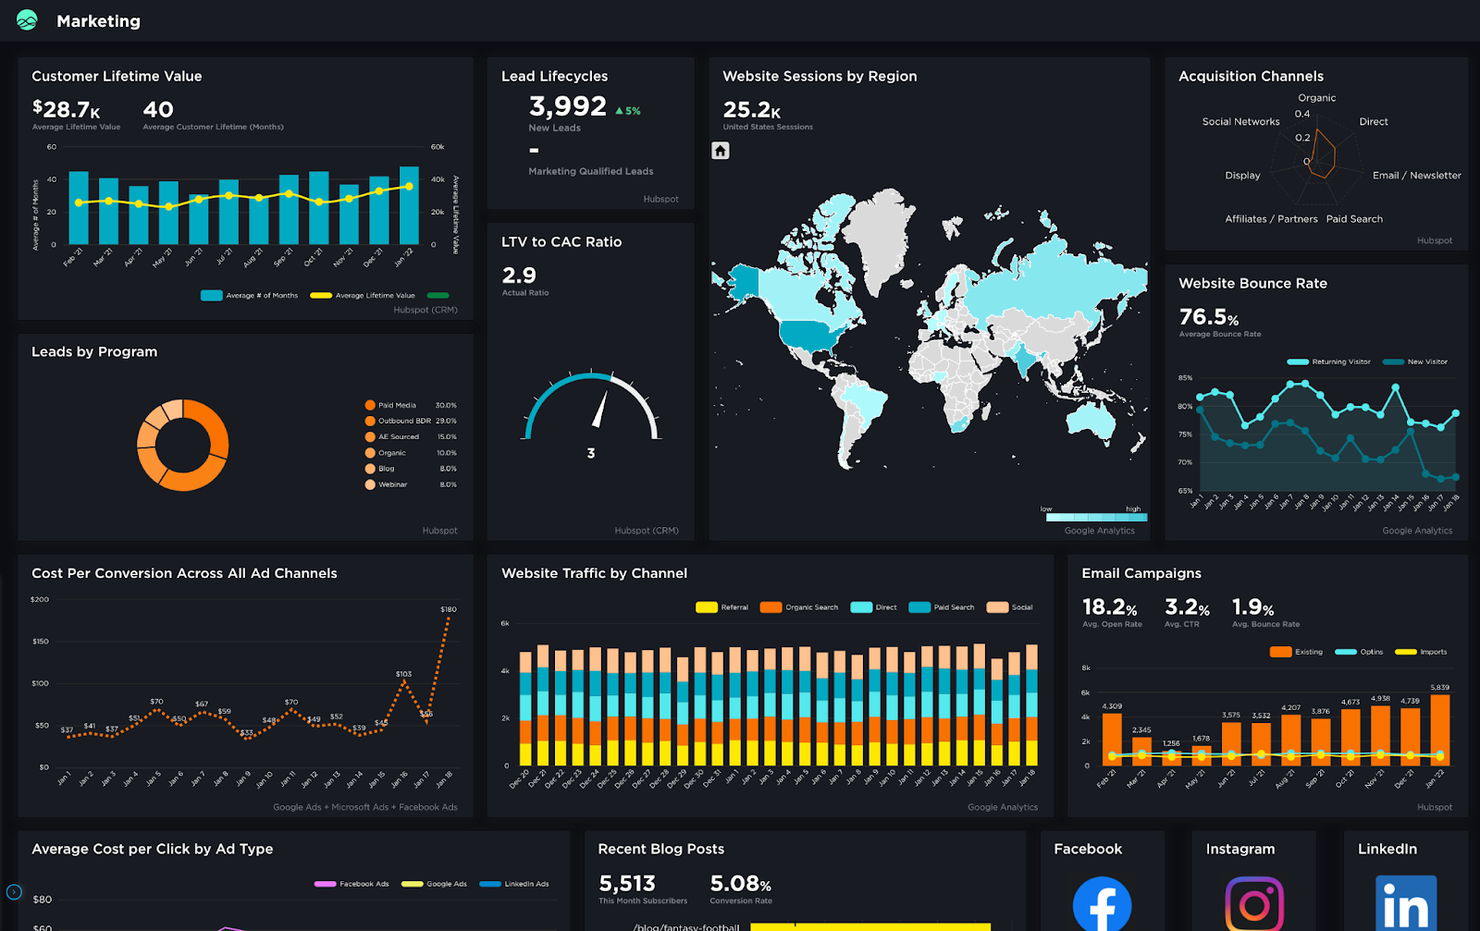
Grow is a modern BI tool that helps you make informed business decisions. The software is highly customizable and allows you to track and manipulate data in order to uncover valuable insights. The solution offers multiple pre-made templates that allow you to turn raw data into structured reports you can understand.
Grow’s Leaderboard dashboards allow you to track the efficiency of different teams or team members. These dashboards help you understand which departments or members of your organization lead in sales or other metrics based on custom criteria.
Grow integrates with dozens of popular solutions, including ActiveCampaign, Airtable, Asana, Box, FreshBooks, Google Ads, HubSpot, Salesforce, and Shopify.
Grow offers custom pricing upon request. The software also offers a free trial on demand.
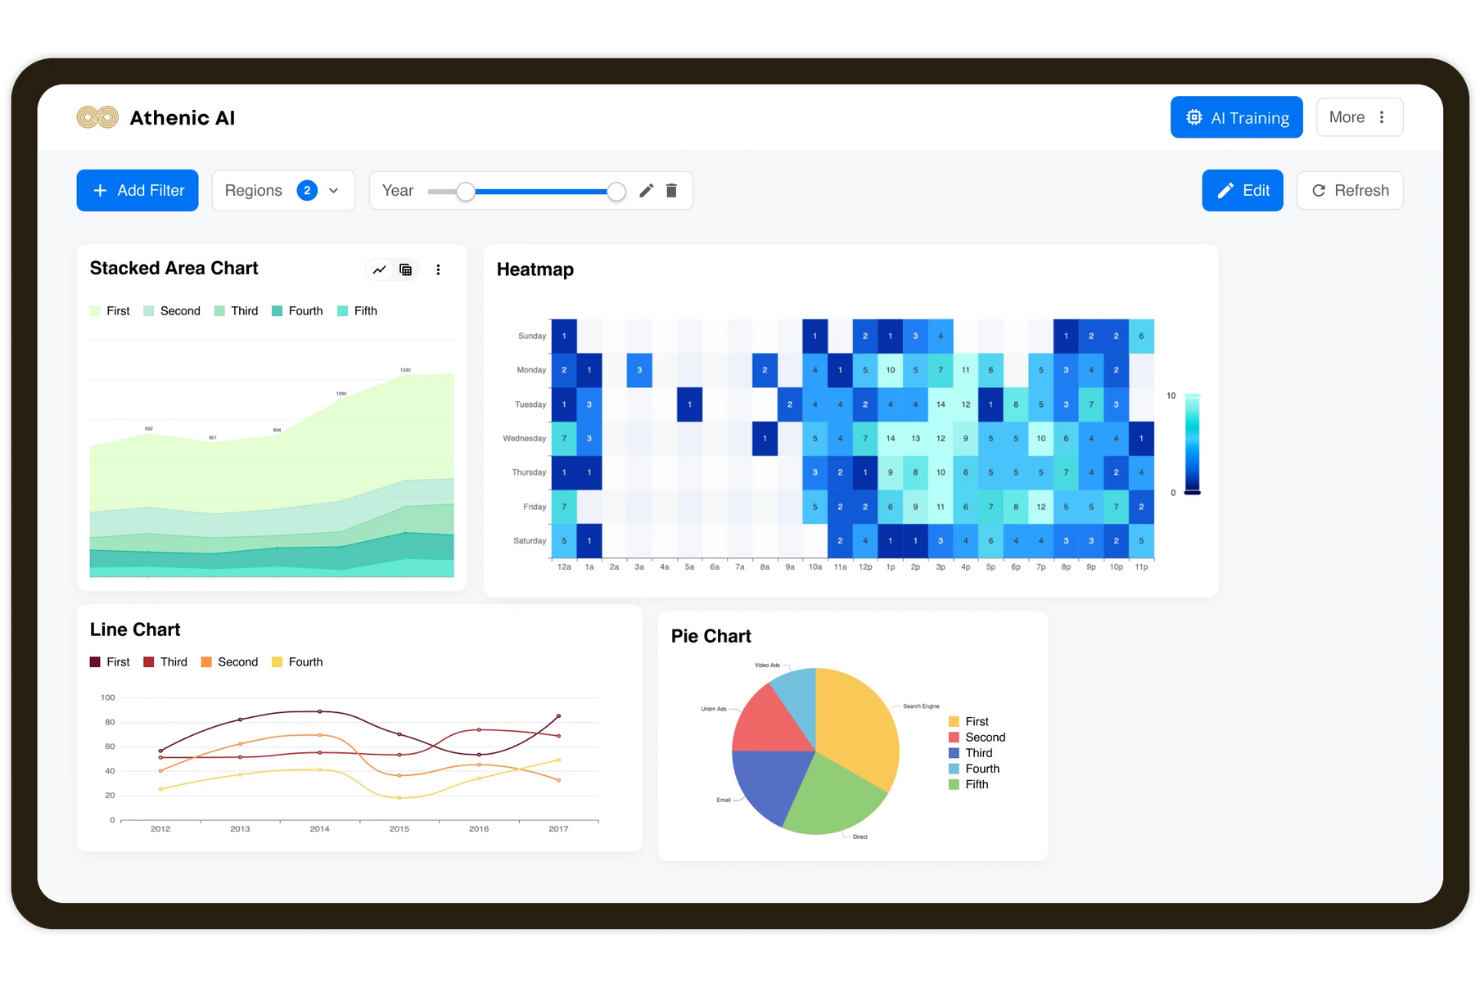
Athenic is an AI-powered business intelligence platform designed to simplify data analysis and enhance decision-making. The tool enables teams to interact with their data through conversational queries, visualize insights instantly, and leverage a powerful knowledge graph for structured, accurate answers. Its Agentic deep research capabilities allow for in-depth data exploration, helping organizations uncover patterns and make informed decisions faster.
The highlight of Athenic is its AI-driven approach to data interaction. With conversational AI and customizable language models, teams can ask questions naturally and generate visualizations in seconds. This makes Athenic especially valuable for organizations seeking to improve BI adoption and collaboration, while supporting both startups and large enterprises.
Athenic integrates with multiple solutions, including Notion, Stripe, AWeber, Asana, Google Calendar, SQL Databases, Data Warehouses, CRMs, ERPs, Marketing Platforms, Python SDK, and REST API.

NetSuite SuiteAnalytics is a BI software that helps businesses make better decisions by allowing them to make sense of big data. The solution is versatile and flexible but has a bit of a learning curve if you’re not familiar with Netsuite’s app ecosystem.
NetSuite SuiteAnalytics pulls data from multiple data sources and helps you understand what’s happening in your organization with real-time searches, KPI tracking, and excellent reporting features. You can customize your reports and create report templates that include business-specific formulas so you can save time in the long run.
NetSuite SuiteAnalytics integrates with dozens of tools via third-party integrators like Zapier.
NetSuite SuiteAnalytics offers custom pricing upon request, as well as a free demo.
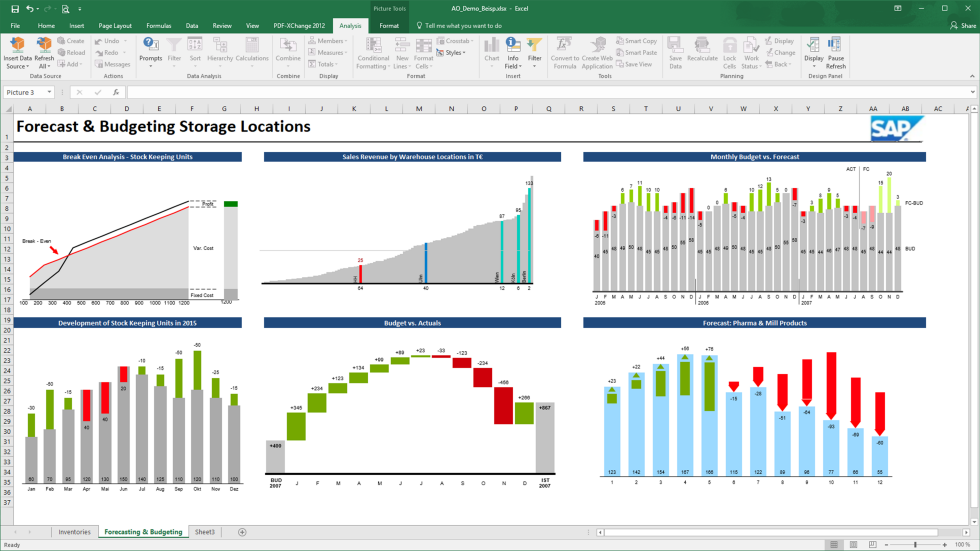
SAP BusinessObjects is a BI tool that enables you to manage your business and resources effectively with predictive analytics. The solution can perform heavy-duty tasks like breaking down large datasets, but it also helps business users who are not versed in SQL to create complex reports.
This software offers a lot of customization options and enables you to create personalized reports with a drag-and-drop editor. The software supports automated deliveries and notifies users when their reports are ready, so you can run it in the background. The tool’s forecasting features enable you to identify potential bottlenecks before they become problematic, so you can reallocate your resources and improve your efficiency.
SAP Business Intelligence integrates with multiple apps, including other business intelligence tools like SAP Roambi and Toucan, but also with solutions like Microsoft Excel, MS PowerPoint, Zoho Expense, MongoDB, DocuWare, and OneStream.
SAP BusinessObjects offers custom pricing upon request. The software also offers a free demo.

Microsoft Power BI is a self-service business intelligence tool that helps businesses of all sizes make sense of their data. The solution has a clean interface, offers multiple data visualization options, and allows business users to track their performance in an interactive dashboard.
One of the good things about this BI platform is that it enables users to customize their reports with a drag-and-drop editor. You can combine charts, maps, and data sets to create a dynamic view of multiple data sources at once, and you can manipulate the data to generate actionable insights.
Microsoft Power BI integrates with Microsoft and third-party apps, including Microsoft Office 365, Teams, Dynamics 365, Workato, SurveyMonkey, Tray, Google Analytics, Google Data Studio, and Tableau CRM.
Microsoft Power BI costs from $13.70/user/month. The software also offers a 60-day free trial.

ClicData is a cloud-based BI solution that makes it easy to track your data and interpret it with the help of interactive dashboards. The tool allows you to collaborate with team members and create reports that offer insights into your activity.
One of the things I liked about ClicData is that you can schedule automatic reports and share them with your team and external collaborators via email. This helps you save time when preparing recurring reports. In addition, you can access ClicData directly in your browser, and the solution is compatible with mobile devices, so you can check your data while on the go.
ClicData integrates with dozens of solutions, including Google Analytics, Bing Ads, QuickBooks, SurveyMonkey, WooCommerce, and Basecamp.
ClicData costs from $75/month. The software also offers a 15-day free trial.
Other Business Intelligence Software
Here are a few more options that didn’t make the best business intelligence software list:
- Cluvio
Transform raw data into data-driven stories
- Phocas
Break down your financial data and create straightforward reports
- Metric Insights
Track your data with a mobile BI solution
- bipp Analytics
Give your web applications reporting features with an embedded BI solution
- Funnel
BI platform that helps you break down your marketing data.
- Domo
Low-code BI platform that enables you to share your reports securely with team members and external collaborators.
- Tableau
BI software that helps you uncover insights with customizable dashboards and reports.
- Looker
Browser-based business intelligence tool that helps you compile large datasets.
- Supermetrics
BI tool that enables you to collect and visualize marketing data.
- Wyn Enterprise
Scalable BI solution that helps you create and share dashboards and reports.


Business Intelligence Software Selection Criteria
When selecting the best business intelligence software to include in this list, I considered common buyer needs and pain points like data visualization capabilities and integration with existing systems. I also used the following framework to keep my evaluation structured and fair:
Core Functionality (25% of total score)
To be considered for inclusion in this list, each solution had to fulfill these common use cases:
- Data visualization
- Dashboard creation
- Reporting and analytics
- Data integration
- Real-time data access
Additional Standout Features (25% of total score)
To help further narrow down the competition, I also looked for unique features, such as:
- Predictive analytics
- Natural language processing
- Customizable alerts
- Mobile accessibility
- AI-driven insights
Usability (10% of total score)
To get a sense of the usability of each system, I considered the following:
- Intuitive interface
- Ease of navigation
- Customization options
- Learning curve
- User feedback mechanisms
Onboarding (10% of total score)
To evaluate the onboarding experience for each platform, I considered the following:
- Availability of training videos
- Interactive product tours
- Access to templates
- Webinars and live training
- Chatbot assistance
Customer Support (10% of total score)
To assess each software provider’s customer support services, I considered the following:
- 24/7 support availability
- Response time
- Help center resources
- Community forums
- Multichannel support options
Value For Money (10% of total score)
To evaluate the value for money of each platform, I considered the following:
- Pricing transparency
- Cost compared to features
- Free trial availability
- Discount options
- Return on investment potential
Customer Reviews (10% of total score)
To get a sense of overall customer satisfaction, I considered the following when reading customer reviews:
- User satisfaction levels
- Commonly reported issues
- Praise for specific features
- Customer loyalty indicators
- Overall rating scores
How to Choose Business Intelligence Software
It’s easy to get bogged down in long feature lists and complex pricing structures. To help you stay focused as you work through your unique software selection process, here’s a checklist of factors to keep in mind:
| Factor | What to Consider |
|---|---|
| Scalability | Can the software grow with your business? Consider if it supports increasing data volumes and user numbers without a drop in performance. |
| Integrations | Ensure it connects with your existing systems like CRM or ERP. Check if there are any limitations or additional costs for integrations. |
| Customizability | Does it allow you to tailor dashboards and reports to fit your needs? Be wary of tools that offer limited customization options. |
| Ease of use | Is the interface intuitive for your team? Avoid tools with a steep learning curve that might necessitate extensive training. |
| Implementation and onboarding | How long does it take to implement? Look for solutions with a clear onboarding process, including training resources and support. |
| Cost | Are there hidden fees? Compare pricing models and ensure you understand what's included in the base price versus add-ons. |
| Security safeguards | Assess the data protection measures in place. Does it comply with industry standards like GDPR or ISO 27001? |
| Support availability | What kind of support does the vendor offer? Check for 24/7 support and the availability of multiple support channels like chat, email, and phone. |
What Is Business Intelligence Software?
Business intelligence software is a tool that helps organizations analyze data to make informed decisions. Professionals like data analysts, managers, and executives use these tools to gain insights and improve business strategies. Data visualization, reporting, and integration capabilities help with understanding trends, identifying opportunities, and optimizing operations. These tools provide users with clear, actionable insights, enhancing decision-making processes.
Features
When selecting business intelligence software, keep an eye out for the following key features:
- Data visualization: Transforms complex data sets into easy-to-understand visual formats, helping users quickly grasp insights.
- Dashboard creation: Allows users to build custom dashboards to monitor key metrics and trends in real-time.
- Reporting and analytics: Provides detailed reports and analytics to support data-driven decision-making.
- Integration capabilities: Connects with existing systems like CRM and ERP for seamless data flow and comprehensive analysis.
- Real-time data access: Offers up-to-date information, enabling timely responses to changing business conditions.
- Predictive analytics: Uses historical data to forecast future trends and outcomes, aiding proactive planning.
- Customizable alerts: Notifies users of significant changes or anomalies in data, keeping them informed of critical developments.
- Mobile accessibility: Ensures users can access data and insights from anywhere, enhancing flexibility and responsiveness.
- Security safeguards: Protects sensitive data with industry-standard security measures, ensuring compliance and data integrity.
Benefits
Implementing business intelligence software provides several benefits for your team and your business. Here are a few you can look forward to:
- Improved decision-making: Access to real-time data and analytics helps users make informed decisions quickly.
- Enhanced data accuracy: Integration capabilities ensure data consistency across systems, reducing errors and discrepancies.
- Increased efficiency: Automated reporting and customizable alerts save time by reducing manual data processing tasks.
- Better strategic planning: Predictive analytics provide insights into future trends, aiding long-term planning and forecasting.
- Greater transparency: Dashboards and data visualization make it easy to share insights and results with stakeholders.
- Flexibility and mobility: Mobile accessibility allows users to access important data and insights on the go.
- Stronger data security: Security safeguards protect sensitive information, ensuring compliance with data protection standards.
Costs & Pricing
Selecting business intelligence software requires an understanding of the various pricing models and plans available. Costs vary based on features, team size, add-ons, and more. The table below summarizes common plans, their average prices, and typical features included in business intelligence software solutions:
Plan Comparison Table for Business Intelligence Software
| Plan Type | Average Price | Common Features |
|---|---|---|
| Free Plan | $0 | Basic reporting, limited data sources, and community support. |
| Personal Plan | $5-$25/user/month | Ad-hoc analysis, data visualization, and email support. |
| Business Plan | $30-$60/user/month | Advanced analytics, dashboard creation, and integration with other tools. |
| Enterprise Plan | $100+/user/month | Customizable solutions, enhanced security, dedicated support, and full analytics. |
FAQs
What is the difference between BI software and data analytics tools?
BI software focuses on providing insights and visualizations from historical data to support decision-making. Data analytics tools, on the other hand, often include predictive analytics and more complex data modeling. If you’re looking to understand past performance and make informed decisions, BI software is a good fit. For predictive capabilities, consider integrating data analytics tools.
How long does it take to implement BI software?
Implementation time varies based on the complexity of the tool and your organization’s needs. Simple setups might take a few days, while more complex integrations could take weeks. To speed up the process, ensure you have a clear plan, involve key stakeholders, and take advantage of vendor support and training resources.
Do I need technical expertise to use business intelligence software?
No, you don’t necessarily need technical expertise to use BI software. Many tools are designed with user-friendly interfaces and offer drag-and-drop functionality for ease of use. However, having a basic understanding of data concepts can be helpful. Look for tools with strong support and training materials to assist your team.
What’s Next:
If you're in the process of researching business intelligence software, connect with a SoftwareSelect advisor for free recommendations.
You fill out a form and have a quick chat where they get into the specifics of your needs. Then you'll get a shortlist of software to review. They'll even support you through the entire buying process, including price negotiations.