

AI Is Changing Pay, Not Just Jobs


Layoff Signal: AI is the leading cited reason for 2026 job cuts, despite overall layoffs declining.
Hiring Freeze: AI-using service firms are reducing hiring plans far more often than they report actual layoffs.
Wage Impact: AI exposure is slowing wage growth, costing affected workers billions while high earners remain largely insulated.
Uneven Burden: Service workers and lower earners absorb the strongest effects, making company-wide compensation averages potentially misleading.
HR Checks: HR teams can identify hidden disruption by comparing exposure-based wages, closed requisitions, and backfill timing.
A recent story from Yahoo Finance caught the attention of LinkedIn AI influencers. Drawing on new labor market data, the article argues that AI isn't displacing American workers.Three reports published in the last eight weeks tell a more specific story, and it's more useful to HR leaders than the reassuring version.
AI-Cited Layoffs: Challenger, Gray & Christmas data shows AI is the single leading cited reason for job cuts in 2026, named in 22% of all cuts this year.
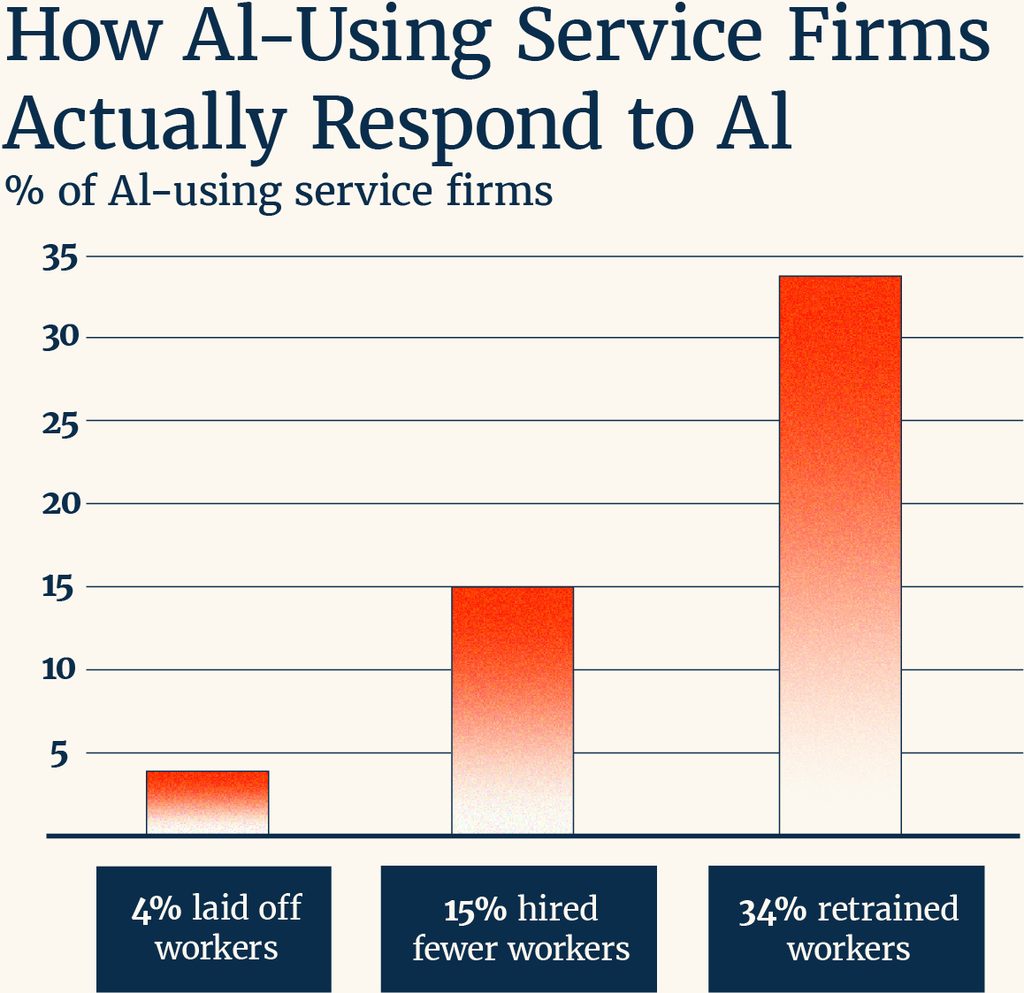
Hiring Suppression: A New York Fed regional survey finds AI-using service firms are cutting hiring plans at nearly four times the rate they report layoffs.

Wage Compression: An Apollo Global Management study puts the cost of slower pay growth for AI-exposed workers at $28 billion a year, spread across 5.8 million people.
Where the Reassuring Version Comes From
The claim traveled fast: job cuts are down, hiring is up, and there's no evidence AI is replacing workers. Apollo Global's chief economist Torsten Sløk has been making a version of this argument for weeks, pointing to Challenger data showing job cuts down 41% year over year through August, the lowest January-to-August total since 2022, alongside hiring plans up 37% over the same period, the highest since 2023.
That part holds up. It's also not the whole report.
What the Reason Codes Actually Show
Before we go all in again on more of the AI is being scapegoated narratives, it’s worth a full look at the data used to support this latest version of the argument.
Challenger's monthly report includes two separate tables: one tracks total job cuts, while the other breaks them down by employers' stated reasons for the layoffs.
In the second table, AI is the single leading cited reason for job cuts so far in 2026, named in 116,175 announcements, 22% of all cuts this year. The overall decline in total cuts traces mostly to a drop in government layoffs from last year's unusually high levels, not to AI becoming less of a factor in the cuts that do happen.
Two things can be true at once: total layoffs can fall, and AI can still be the most common reason for the layoffs that remain.
The hiring-suppression finding above comes from a New York Fed survey of AI-using service firms, broken out below.
This Isn't Our First Time Doing This
Wages absorbing an automation shock instead of headcount has a precedent. Industrial robots produced close to the same pattern, years before generative AI existed as a workplace tool.
In a study published in the Journal of Political Economy, MIT's Daron Acemoglu and Boston University's Pascual Restrepo tracked robot adoption across 19 industries and 722 US commuting zones between 1990 and 2007.
Their central finding: each additional robot per 1,000 workers reduced the employment-to-population ratio by roughly 0.2 percentage points and wages by roughly 0.42%. The effect built up gradually inside local labor markets over years, rather than through a wave of headline layoffs.
The impact also wasn't spread evenly. The researchers found it concentrated most heavily among less-educated workers, particularly in manufacturing, while workers higher up the pay scale were largely insulated. That lines up closely with the shape Apollo found in this year's AI data, with service workers and the bottom earnings quartile absorbing the bulk of the wage effect and top earners seeing none of it.
The comparison has limits though. Industrial robots are physical, expensive capital investments. AI tools are cheap and can spread through an organization in weeks, which could mean this plays out faster, slower, or differently in ways the robots' data can't predict.
What that research does establish is that this exact pattern, disruption landing on pay and participation rather than employment counts, has already played out once in measurable, published data, well before AI made it a live question again.
The Missing $4,800
Apollo's $28 billion figure, the total wage growth lost across AI-exposed workers in the study, is reported as a single average: $4,800 a year, spread across 5.8 million workers.
Averages hide how unevenly that number is distributed, and it's worth noting the arithmetic the topline figure skips.
Within that group, service workers experienced a 24.3% relative decline in wage growth and the bottom earnings quartile a 10.7% decline, while the highest earners saw no measurable effect at all.
That's a wider spread than the $4,800 average lets on, and it lands hardest on people already earning the least. A call center employee or a retail associate absorbing close to a quarter less wage growth is losing far more than the average, on top of a smaller paycheck to begin with. Someone already earning well in a high-exposure occupation may be feeling almost none of it.
That matters for how this shows up, or doesn't, in most compensation reporting. A company reviewing its overall average wage growth this year could see a number that looks close to normal, because workers earning enough to be unaffected are pulling the average back up.
The compression is real for the workers experiencing it, but it stays invisible in the blended number leadership is most likely to see first.
What to Check in Your Own Data
None of the three reports behind this required proprietary data, and neither does checking for it internally.
Challenger's numbers come from public job cut announcements. The New York Fed surveys firms directly and publishes the results. Apollo built its estimate from Bureau of Labor Statistics data.
For a rough sense of the scale by state, the Center for AI Safety's wageloss.ai dashboard converts Challenger's AI-attributed layoffs into a dollar estimate, though it only sees the layoffs channel, not the wage compression or hiring suppression that needs more focus. The pattern underneath all of it is visible in data most organizations already have.
A few starting points for a comp or HR team that wants to check:
- Segment wage growth by AI exposure, not just by department. Pull trailing 24-month wage growth for roles where AI tools are in regular use, and compare it against otherwise-similar roles at the same level and tenure where they aren't. A blended department-wide average can hide the same compression a national average does.
- Check for reqs that closed instead of filled. Neither Challenger nor the NY Fed survey can see a requisition that gets approved and then closes without a hire. Most applicant tracking systems can. That number, for AI-exposed roles specifically, is closer to what the NY Fed's 15% "hired fewer" figure is measuring than anything in a headcount report.
- Watch backfill time, not just backfill rate. A growing gap between when someone leaves an AI-exposed role and when it's filled again, even if it eventually does get filled, is often the earliest visible version of this pattern, well before it shows up in an engagement survey or an exit interview.
- Put compensation and AI adoption planning in the same room. L&D or whoever runs the AI rollout typically owns the retraining budget. Compensation owns the wage budget. If a role gets retraining investment this year while its wage growth falls behind, the two teams tracking those separate numbers may never compare notes, so the connection only gets made if someone above both of them asks each the same question.
None of this requires waiting on the next Challenger report or the next Fed survey. The data to check is largely sitting in an HRIS and an ATS already.