10 Best KPI Software Solutions for 2026

Best KPI Software Shortlist


KPI software helps you track, visualize, and manage key performance indicators so you can measure progress toward your business goals. If you’re searching for the best KPI software, you likely need reliable tools to monitor metrics, share insights, and support data-driven decisions across your team or organization. With so many options available, it’s essential to find software that fits your reporting needs, integrates with your existing systems, and adapts as your priorities change. This guide will help you compare top KPI software for 2026, so you can choose the right solution to support your performance management strategy.
Why Trust Our Software Reviews
We’ve been testing and reviewing HR software systems since 2019. As HR experts ourselves, we know how critical and difficult it is to make the right decision when selecting software.
We invest in deep research to help our audience make better software purchasing decisions. We’ve tested more than 2,000 tools for different HR management use cases and written over 1,000 comprehensive software reviews. Learn how we stay transparent & our software review methodology.
Best KPI Software Summary
This comparison chart summarizes pricing details for my top KPI software selections to help you find the best one for your budget and business needs.
| Tool | Best For | Trial Info | Price | ||
|---|---|---|---|---|---|
| 1 | Best for custom dashboard creation | 14-day free trial | From $120/month (billed annually) | Website | |
| 2 | Best for strategic goal alignment | Free trial + free demo available | Pricing upon request | Website | |
| 3 | Best for advanced data visualization | Free trial + free plan available | From $15/user/month (billed annually) | Website | |
| 4 | Best for financial metric visualization | 14-day free trial available | From $53/month | Website | |
| 5 | Best for marketing analytics integration | Free plan + free demo available | From $7/user/month (billed annually) | Website | |
| 6 | Best for mobile performance monitoring | Free plan + free trial + free demo available | From $64/month (billed annually) | Website | |
| 7 | Best for enterprise data connectivity | 30-day free trial + free demo available | Pricing upon request | Website | |
| 8 | Best for integrated business management | 14-day free trial | From $19.99/month | Website | |
| 9 | Best for quick metric tracking setup | 14-day free trial | From $11/user/month (billed annually) | Website | |
| 10 | Best for balanced scorecard frameworks | 30-day free trial + free demo available | Pricing upon request | Website |
-

Justworks
Visit WebsiteThis is an aggregated rating for this tool including ratings from Crozdesk users and ratings from other sites.4.6 -
Paycom
Visit WebsiteThis is an aggregated rating for this tool including ratings from Crozdesk users and ratings from other sites.4.3 -
Native Teams
Visit WebsiteThis is an aggregated rating for this tool including ratings from Crozdesk users and ratings from other sites.4.6


Best KPI Software Reviews
Below are my detailed summaries of the best KPI software that made it onto my shortlist. My reviews offer a detailed look at the features, best use cases, and integrations of each software to help you find the best one for you.
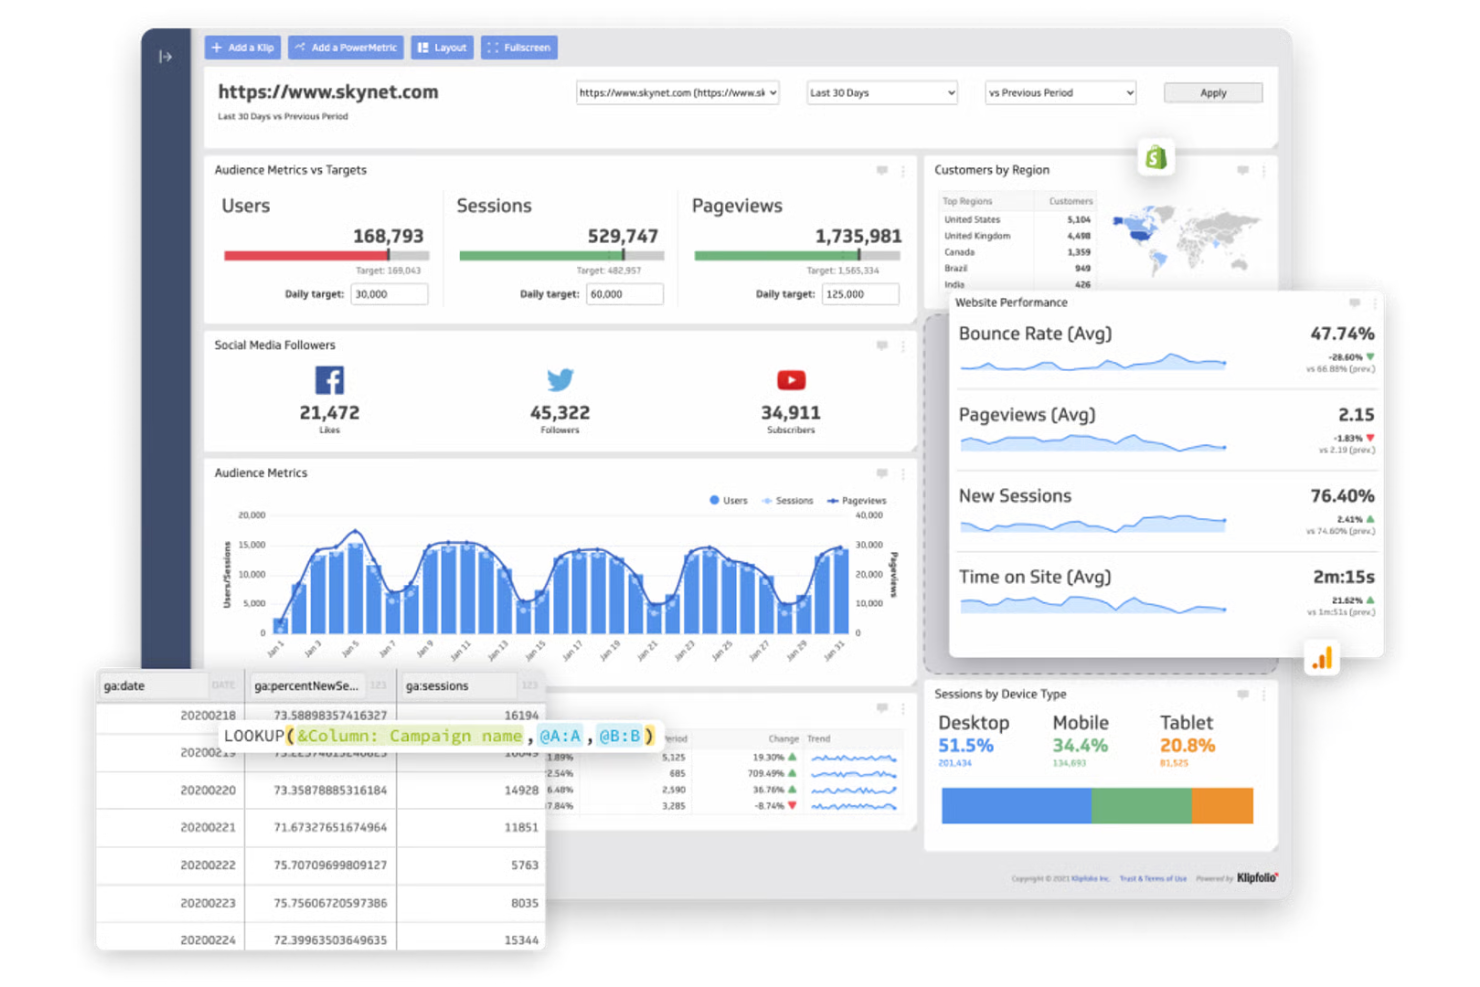
If you need to build dashboards tailored to your team’s exact KPIs, Klipfolio gives you flexible tools to do just that. Marketing teams, agencies, and operations leaders use Klipfolio to connect multiple data sources and design custom visualizations that fit their unique reporting needs. Its focus on dashboard customization helps you track the metrics that matter most to your business.
Why I Picked Klipfolio
For teams that want dashboards built around their own KPIs, Klipfolio stands out for its custom dashboard creation capabilities. I picked Klipfolio because it lets you design dashboards from scratch, using a drag-and-drop editor and a wide range of visualization options. You can pull in data from dozens of sources and arrange metrics exactly how you want, making it easy to highlight the KPIs that matter most to your business. This level of customization is especially useful for organizations with unique reporting requirements or rapidly changing metrics.
Klipfolio Key Features
Some other features that make Klipfolio useful for KPI tracking include:
- Pre-Built Data Connectors: Connect quickly to popular services like Google Analytics, Salesforce, and HubSpot.
- Automated Data Refresh: Schedule regular updates so your dashboards always show current KPI data.
- Role-Based Permissions: Control who can view or edit specific dashboards and reports.
- Mobile Dashboard Access: View and interact with dashboards from any mobile device.
Klipfolio Integrations
Integrations include Google Analytics, Salesforce, HubSpot, Facebook Ads, Google Sheets, Shopify, Xero, QuickBooks, Mailchimp, and more.
Pros and Cons
Pros:
- White-labeling supports client-facing reporting
- Real-time data refresh for live dashboards
- Custom formulas allow advanced KPI calculations
Cons:
- No built-in predictive analytics for KPIs
- Data source limits on lower-tier plans
Cascade is designed for organizations that want to connect high-level strategy with measurable KPIs across teams. Strategy leaders, HR professionals, and department heads use Cascade to align goals, track progress, and ensure everyone is working toward shared outcomes. Its focus on strategic goal alignment helps you bridge the gap between planning and execution in a way that’s visible and actionable.
Why I Picked Cascade
Unlike many KPI tools that focus only on tracking metrics, Cascade stands out for its ability to connect KPIs directly to strategic goals. I picked Cascade because it lets you map out your organization’s objectives and link them to measurable outcomes, making it easier to see how daily work supports long-term strategy. The platform’s goal alignment features help you break down company-wide priorities into team and individual targets, so everyone knows what success looks like. This approach is especially useful for organizations that want to ensure every KPI is tied to a bigger-picture objective.
Cascade Key Features
In addition to its goal alignment capabilities, Cascade offers several other features for KPI management:
- Automated Progress Tracking: The platform updates KPI progress automatically as data is entered or synced.
- Custom Dashboard Builder: Create personalized dashboards to visualize KPIs and strategic metrics.
- Collaboration Tools: Assign tasks, comment on goals, and share updates within the platform.
- Strategy Map Visualization: View how different goals and KPIs connect using interactive strategy maps.
Cascade Integrations
Integrations include Salesforce, Asana, SAP, Snowflake, Oracle, Tableau, BambooHR, and HubSpot.
Pros and Cons
Pros:
- Supports automated progress tracking on goals
- Offers visual strategy mapping for KPIs
- Links KPIs directly to strategic objectives
Cons:
- Static and rigid printed reports
- Limited export options for KPI reports
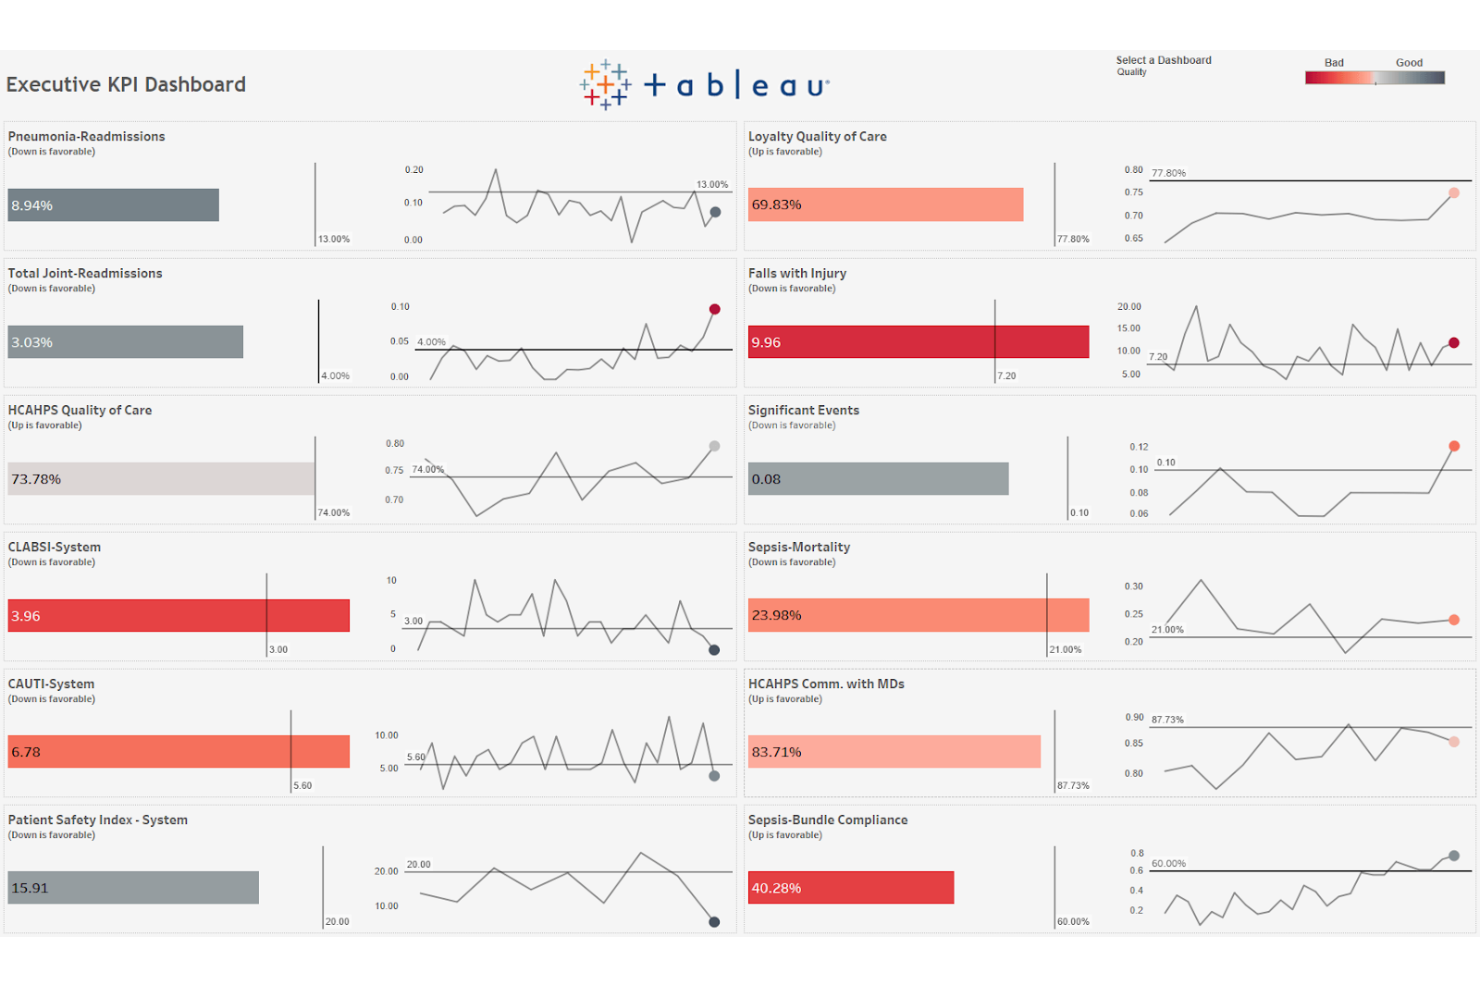
When you need to turn complex data into clear, interactive visuals, Tableau is a top choice. Data analysts, business intelligence teams, and operations leaders use Tableau to build advanced dashboards that make KPI trends and outliers easy to spot. Its flexible visualization tools help you dig into large datasets and share insights with stakeholders across your organization.
Why I Picked Tableau
Unlike many KPI tools that offer basic charts, Tableau gives you advanced data visualization options that help you uncover deeper insights. I picked Tableau because it lets you build interactive dashboards with custom filters, drill-downs, and dynamic visual elements that make KPI data more actionable. Its ability to handle large, complex datasets means you can visualize trends, outliers, and relationships that might otherwise go unnoticed. For teams that need to present KPIs in a visually compelling and flexible way, Tableau offers a level of control and sophistication that’s hard to match.
Tableau Key Features
Some other features that make Tableau valuable for KPI tracking include:
- Scheduled Data Refreshes: Set up automatic updates to ensure dashboards always display the latest KPI data.
- Data Blending: Combine data from multiple sources within a single visualization for a more complete KPI view.
- Role-Based Access Controls: Manage who can view or edit specific dashboards and reports.
- Mobile Dashboard Support: Access and interact with KPI dashboards from smartphones and tablets.
Tableau Integrations
Native integrations are not currently listed.
Pros and Cons
Pros:
- Offers advanced drill-down and filtering options
- Handles large datasets without lags
- Supports highly interactive KPI dashboards
Cons:
- Lacks built-in KPI goal tracking templates
- Requires desktop app for full dashboard creation
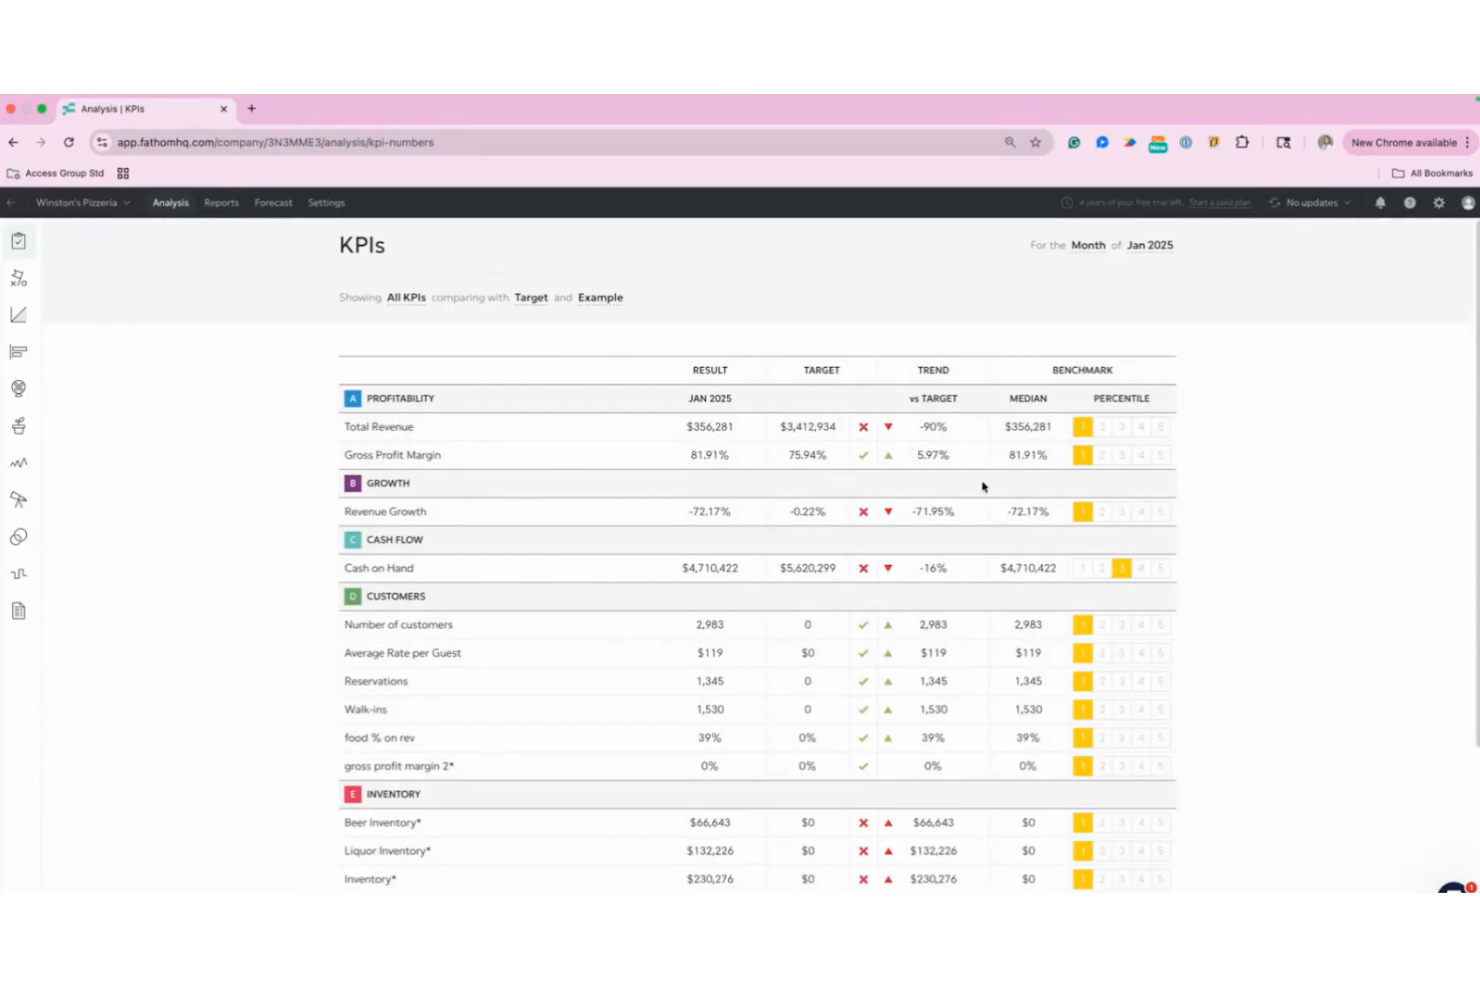
Fathom is designed for finance teams and business leaders who need to visualize and analyze financial KPIs with clarity. Its interactive dashboards and in-depth financial analysis tools help you turn accounting data into actionable insights. If your priority is understanding profitability, cash flow, and growth trends at a glance, Fathom offers specialized features for financial metric visualization.
Why I Picked Fathom
When it comes to visualizing financial metrics, Fathom offers a level of depth that’s hard to match in KPI software. I picked Fathom because its financial analysis tools let you break down profitability, cash flow, and growth trends using interactive charts and visual reports. The platform’s KPI builder allows you to create custom financial metrics tailored to your business, while its benchmarking feature helps you compare performance across multiple entities or periods. For finance teams that need to turn complex accounting data into clear, actionable visuals, Fathom is purpose-built for the job.
Fathom Key Features
Some other features that make Fathom valuable for KPI tracking include:
- Automated Consolidations: Combine financial data from multiple entities for group reporting.
- Report Editor: Build and customize visual reports with drag-and-drop tools.
- Forecasting Module: Project future financial performance using built-in forecasting tools.
- Alerts and Notifications: Set up automated alerts for key financial thresholds or metric changes.
Fathom Integrations
Integrations include QuickBooks Online, QuickBooks Desktop, Xero, MYOB AccountRight, Excel, Google Sheets, and more.
Pros and Cons
Pros:
- Offers customizable financial report templates
- Consolidates data from multiple entities
- Visualizes financial KPIs with interactive charts
Cons:
- Manual data refresh needed for some sources
- Limited non-financial KPI tracking options
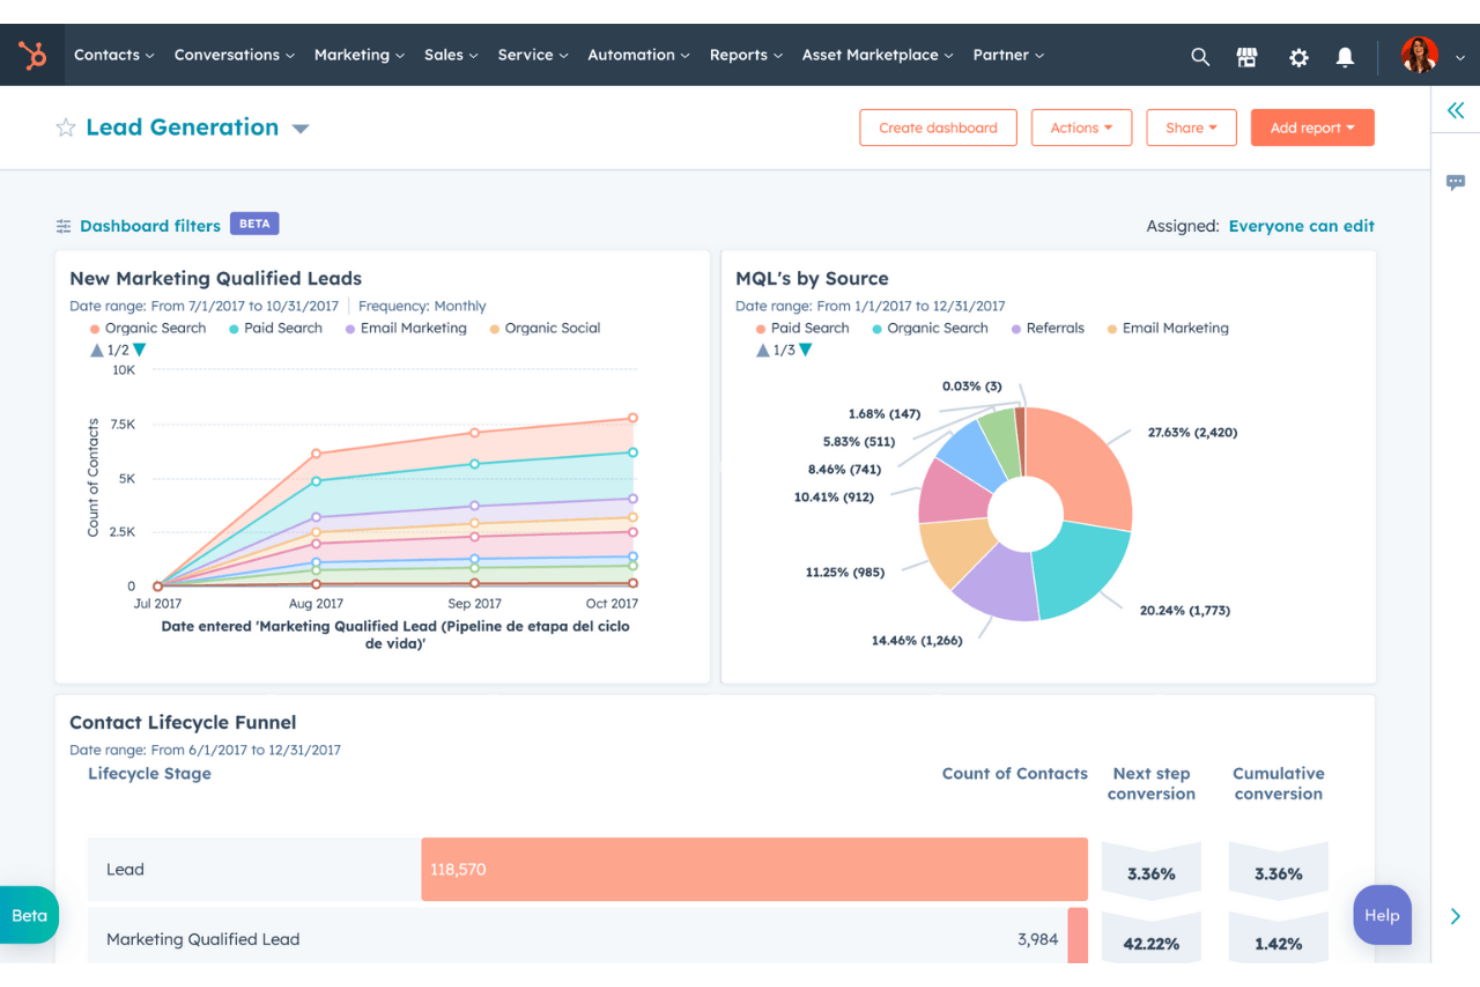
If you’re looking for KPI software that connects marketing analytics with sales and service data, HubSpot is worth considering. Marketing teams and revenue leaders use HubSpot to track campaign performance, website engagement, and lead conversion in one place. Its unified dashboard helps you visualize marketing KPIs alongside other business metrics for a complete view of your funnel.
Why I Picked HubSpot
For teams that need to connect marketing analytics directly to their KPI tracking, HubSpot stands out for its unified approach. I picked HubSpot because it lets you pull campaign, website, and lead data into customizable dashboards, so you can monitor marketing performance in real time. The platform’s attribution reporting helps you see which channels drive conversions, while its funnel analytics break down each stage of the customer journey. If you want to measure marketing KPIs alongside sales and service metrics, HubSpot brings everything together in one place.
HubSpot Key Features
Some other features that make HubSpot useful for KPI tracking include:
- Custom Report Builder: Create tailored reports using data from multiple sources within HubSpot.
- Automated Email Tracking: Monitor email open rates, click rates, and engagement metrics automatically.
- Contact and Company Scoring: Assign scores to leads and accounts based on custom criteria and behaviors.
- Workflow Automation: Set up automated processes to update KPIs or trigger actions based on specific events.
HubSpot Integrations
Integrations include Gmail, Outlook, Google Calendar, Microsoft Teams, Slack, Salesforce, Zoom, WordPress, Google Meet, and more.
Pros and Cons
Pros:
- Tracks website and landing page analytics
- Offers multi-touch attribution reporting
- Connects marketing, sales, and service KPIs
Cons:
- Custom event tracking setup can be complex
- Limited financial KPI tracking capabilities
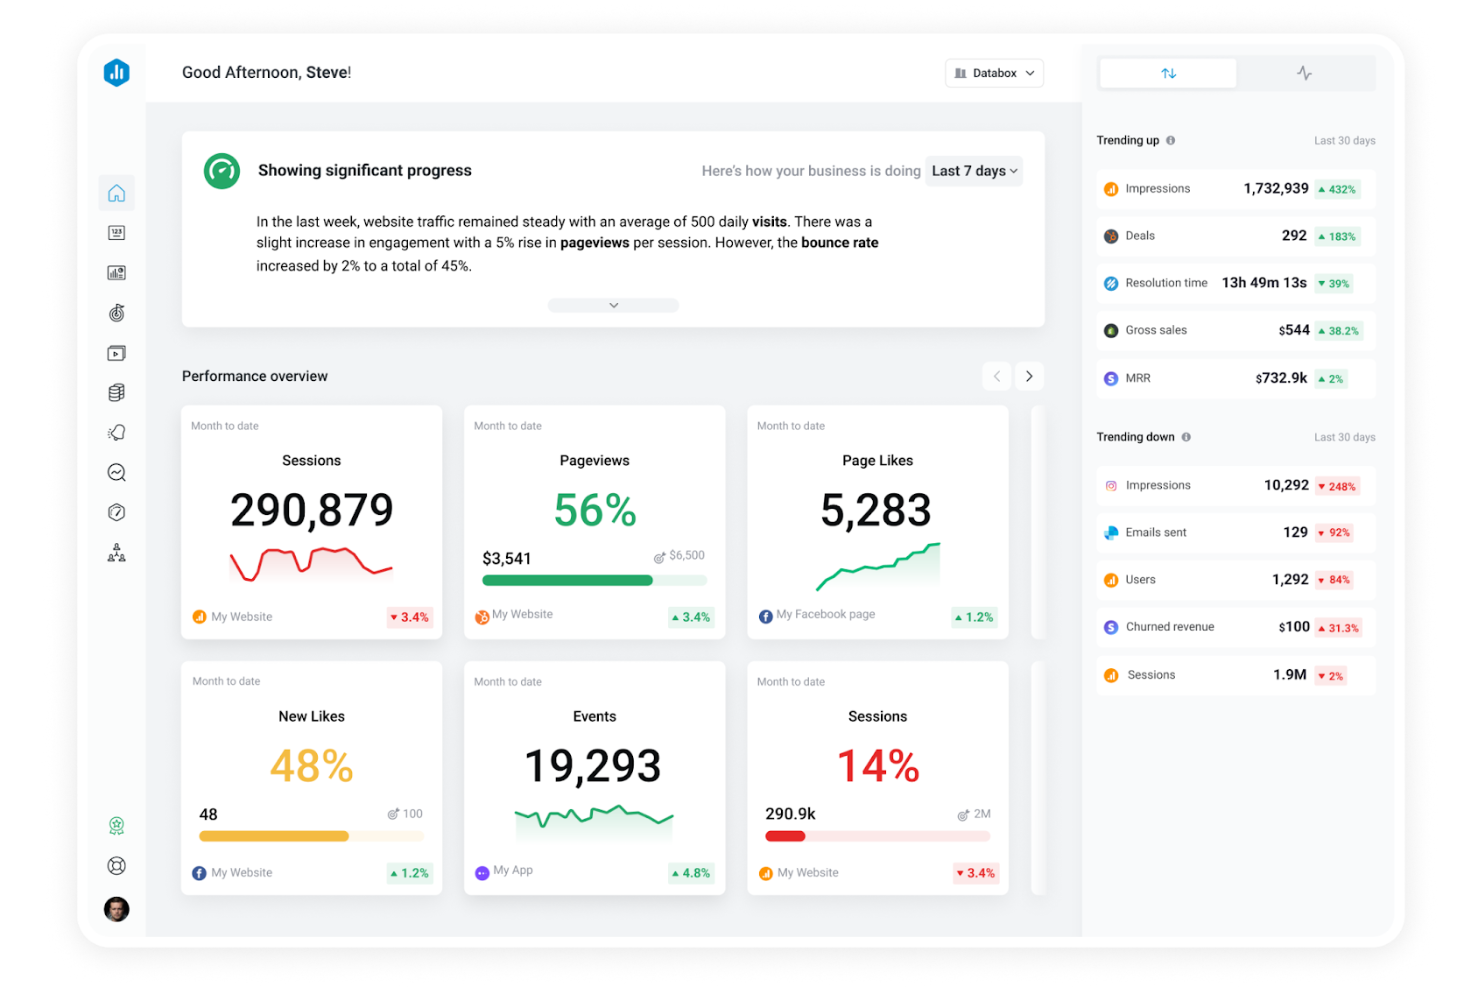
Databox stands out for teams that need to monitor KPIs and business performance on the go. Its mobile-first dashboards and real-time alerts make it a strong fit for marketing agencies, sales teams, and executives who want instant access to data from anywhere. If you’re looking for KPI dashboard software that prioritizes mobile performance monitoring and quick insights, Databox is built for that need.
Why I Picked Databox
Mobile performance monitoring is where Databox really shines, making it a strong choice for KPI software if you need real-time access to business data from anywhere. I picked Databox because its mobile app delivers live dashboards, push notifications, and instant alerts, so you never miss a key metric or sudden change. The platform also lets you customize mobile dashboards for different roles, ensuring that each team member sees the most relevant KPIs on their device. For organizations that value on-the-go decision-making, Databox puts actionable insights right in your pocket.
Databox Key Features
Some other features that make Databox useful for KPI tracking include:
- Data Calculations: Create custom metrics by combining data from multiple sources within the platform.
- Goal Tracking: Set, monitor, and visualize progress toward specific business goals directly in your dashboards.
- Scheduled Reporting: Automate the delivery of performance reports to your team or stakeholders on a set schedule.
- Data Snapshots: Capture and share static views of your dashboards for quick updates or presentations.
Databox Integrations
Integrations include Google Analytics 4, HubSpot Marketing, HubSpot CRM, Google Sheets, Facebook Ads, Excel, LinkedIn Ads, Shopify, and more.
Pros and Cons
Pros:
- Push notifications for metric shifts
- Native connectors for 100+ sources
- Mobile app delivers real-time KPI alerts
Cons:
- Custom metric setup can be time-consuming
- Limited historical data retention on lower plans
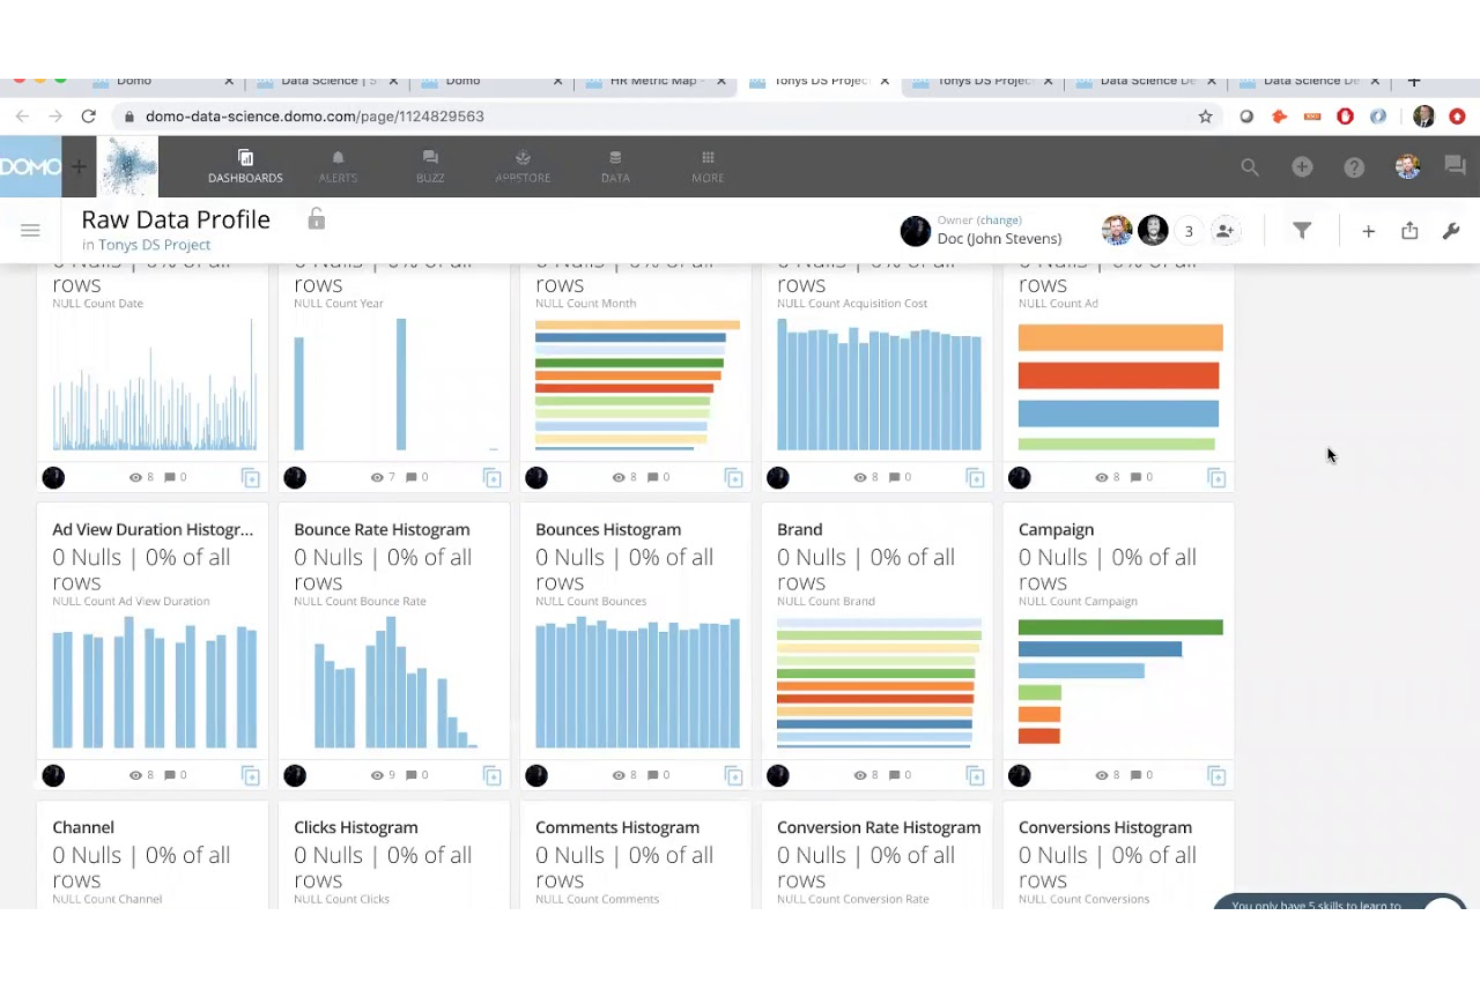
Domo is built for organizations that need to connect and analyze data from a wide range of enterprise systems. IT leaders, data analysts, and operations teams use Domo to unify data sources and manage KPIs across complex business environments. Its strength in large-scale data connectivity helps you monitor performance metrics from every corner of your organization.
Why I Picked Domo
When you need to bring together data from dozens or even hundreds of enterprise systems, Domo’s data connectivity features make it a strong choice for KPI software. I picked Domo because it offers built-in data pipelines and connectors that let you centralize information from cloud apps, databases, and on-premise sources. Its data transformation tools help you clean and prepare data for KPI tracking without leaving the platform. This level of connectivity is especially valuable for organizations with complex data environments and a need for unified, organization-wide KPI monitoring.
Domo Key Features
Some other features that make Domo useful for KPI management include:
- Custom Alerts: Set up automated notifications when KPIs hit specific thresholds.
- Data Visualization Library: Access a wide range of chart types and visual widgets for KPI reporting.
- Mobile App Access: Monitor and interact with dashboards from any mobile device.
- Embedded Analytics: Integrate Domo dashboards and KPI reports directly into other business applications.
Domo Integrations
Integrations include Salesforce, SAP, Google Sheets, MySQL, HubSpot, Shopify, Oracle, and Snowflake.
Pros and Cons
Pros:
- Embedded analytics for sharing KPI dashboards
- No-code ETL data transformation
- Custom alerts for KPI threshold monitoring
Cons:
- Significant latency with complex dataflows
- Unpredictable consumption-based credit pricing
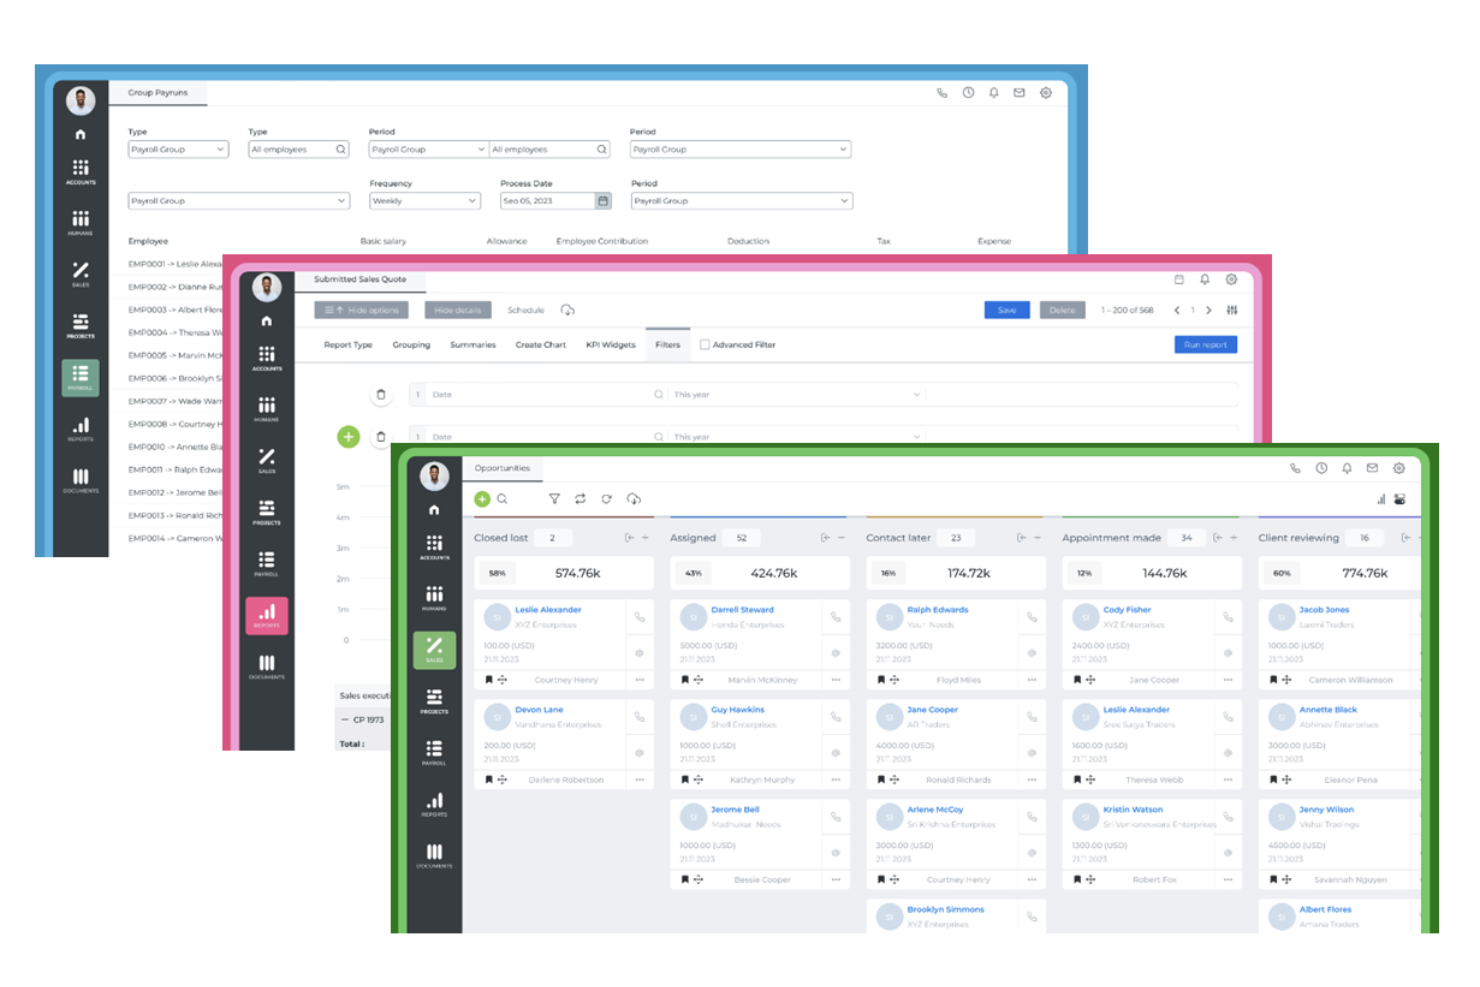
KPI brings together KPI tracking with a full suite of business management tools in one platform. It’s a strong choice for organizations that want to connect performance metrics with accounting, HR, CRM, and project management in a single system. If you’re looking for KPI software that supports integrated workflows across multiple business functions, KPI is designed to centralize your data and processes.
Why I Picked KPI
What sets KPI apart is its ability to combine KPI tracking with a full suite of integrated business management tools. I picked this platform because it lets you monitor performance metrics alongside accounting, HR, CRM, and project management—all within the same environment. This integration means you can connect your KPIs directly to operational data, making it easier to see how business activities impact results. For teams that want to manage both their metrics and their day-to-day operations in one place, KPI offers a unified approach that’s hard to find elsewhere.
KPI Key Features
In addition to its integrated business management capabilities, KPI offers several other features worth noting:
- Customizable Dashboards: Build dashboards tailored to your team’s specific KPIs and reporting needs.
- Automated Alerts: Set up notifications to flag when KPIs hit certain thresholds or targets.
- Document Management: Store and organize files related to your KPIs and business processes within the platform.
- Multi-Currency Support: Track and report on KPIs across different currencies for global operations.
KPI Integrations
Integrations include Microsoft Office, PayPal, Stripe, and more.
Pros and Cons
Pros:
- Multi-currency support for global teams
- Built-in document management for KPI files
- Combines KPI tracking with business management
Cons:
- Limited visualization options for advanced users
- Interface can feel cluttered with features
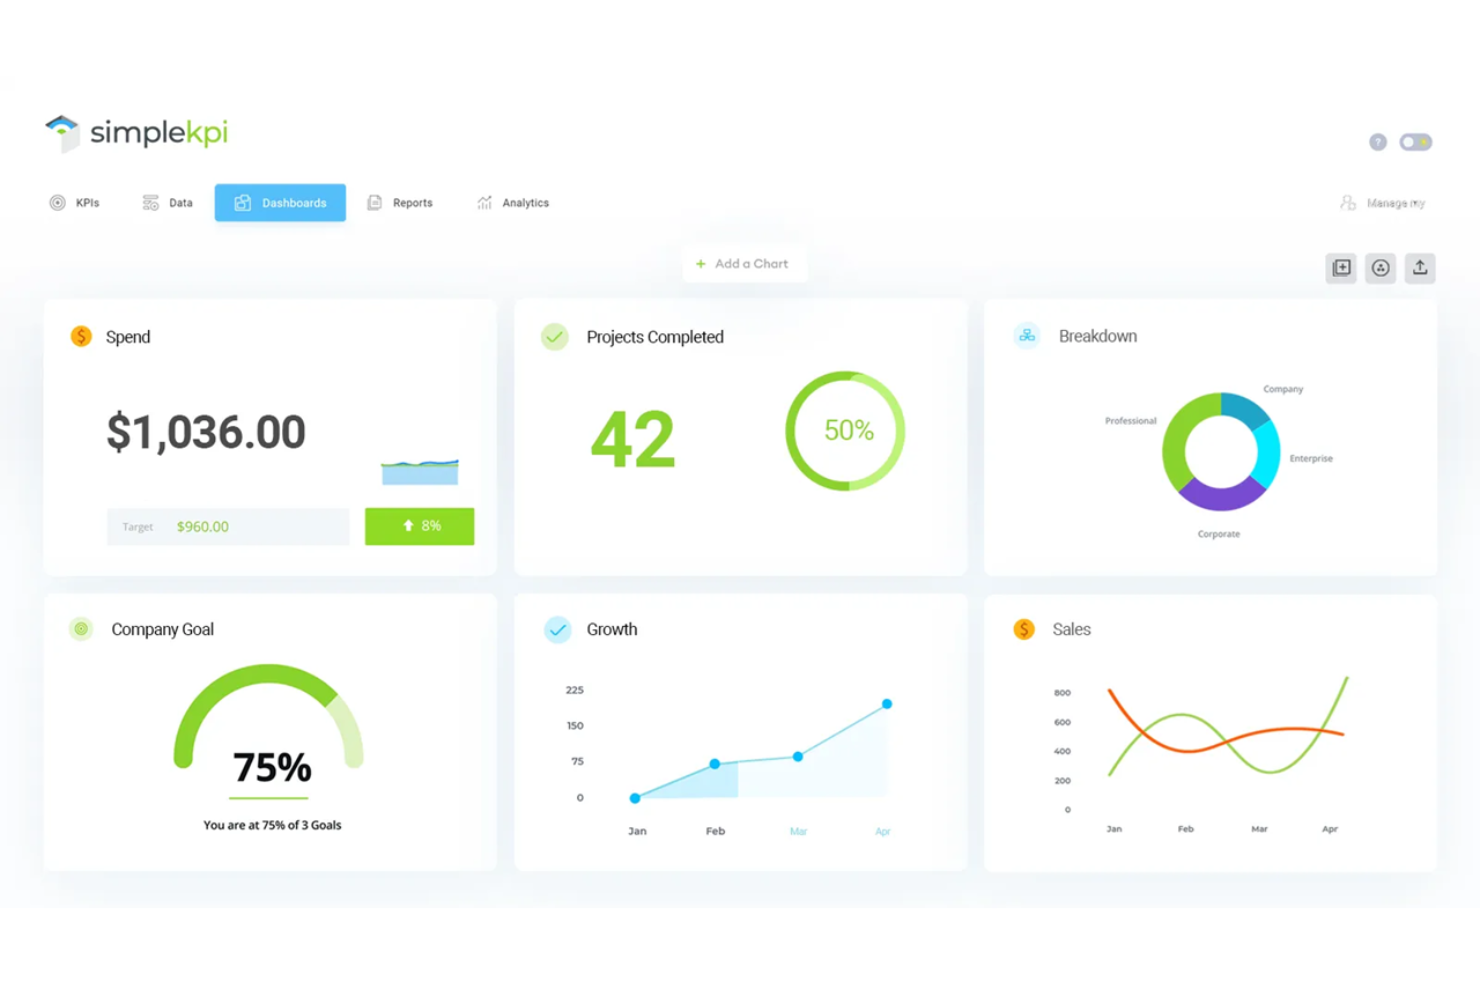
SimpleKPI offers a straightforward way to set up and track key metrics without a steep learning curve. It’s a good fit for small businesses or teams that want to get started with KPI tracking quickly, without complex configuration. If you need a tool that helps you visualize and monitor performance data right away, SimpleKPI is designed for fast onboarding and ease of use.
Why I Picked SimpleKPI
For teams that want to get up and running with KPI tracking right away, SimpleKPI stands out for its quick metric tracking setup. I picked this tool because it lets you create and customize dashboards in just a few clicks, so you can start monitoring performance without a lengthy implementation. The platform’s pre-built KPI templates help you define and track common business metrics instantly. You can also set up automated data imports, which means you spend less time on manual entry and more time reviewing results.
SimpleKPI Key Features
Some other features in SimpleKPI that may interest you include:
- Scheduled Reporting: Set up automated reports to be delivered to your inbox on a regular basis.
- User Access Controls: Assign different permission levels to users to manage who can view or edit specific KPIs.
- Goal Setting: Define targets for each KPI and track progress against those goals within the dashboard.
- Data Export Options: Export your KPI data in multiple formats, including CSV and PDF, for further analysis or sharing.
SimpleKPI Integrations
Integrations are available via Zapier.
Pros and Cons
Pros:
- Automated email reports for teams
- Templates for marketing and finance
- Fast dashboard setup for new users
Cons:
- Data import options are mostly manual
- No native integrations with other platforms
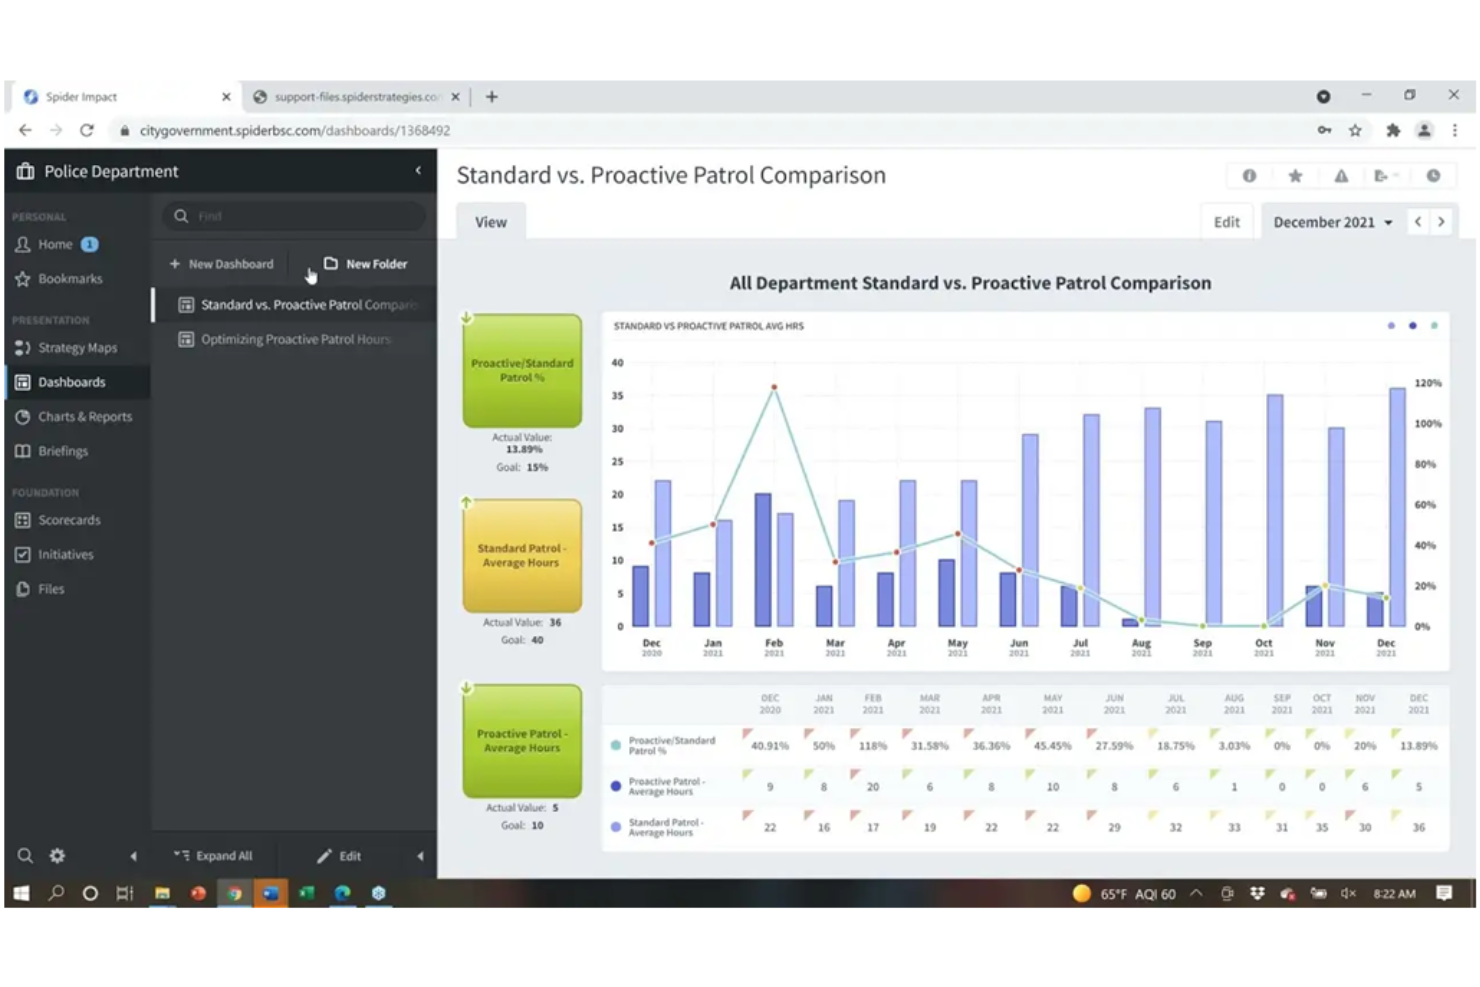
Spider Impact is built for organizations that want to implement and manage balanced scorecard frameworks alongside their KPI tracking. It’s especially useful for strategy teams and leaders who need to align business objectives, measures, and initiatives in one place. If you’re looking for KPI software that supports strategic planning and performance management with a focus on balanced scorecards, Spider Impact is designed for that purpose.
Why I Picked Spider Impact
For teams that want to build their KPI tracking around a balanced scorecard approach, Spider Impact offers a focused solution. I picked this tool because it lets you map out objectives, measures, and initiatives directly within the balanced scorecard framework, making it easier to connect strategy with performance data. The platform supports strategy mapping and cascading scorecards, so you can align goals across departments and track progress at every level. If your organization relies on structured strategic planning, Spider Impact brings those elements together in a way that’s purpose-built for balanced scorecard users.
Spider Impact Key Features
Some other features that make Spider Impact stand out include:
- Automated Data Collection: Pull performance data from multiple sources to keep KPIs updated in real time.
- Role-Based Access Controls: Assign permissions and visibility based on user roles within your organization.
- Custom Report Builder: Design and schedule reports tailored to your team’s specific needs.
- Initiative Tracking: Monitor the status and progress of projects linked to your KPIs.
Spider Impact Integrations
Integrations include Salesforce, Google Analytics, Jira, QuickBooks, MySQL, Microsoft SQL Server, Oracle, IBM DB2, SAP HANA, and more.
Pros and Cons
Pros:
- Initiative tracking linked to performance measures
- Custom report builder for KPI analysis
- Built-in balanced scorecard strategy mapping
Cons:
- Limited visualization types for dashboards
- No public pricing details available
Other KPI Software
Here are some additional KPI Software options that didn’t make it onto my shortlist, but are still worth checking out:
- Qlik Cloud Analytics
For interactive data exploration
- Scoro
For project performance insights
- monday AI Work Platform
For workflow automation integration
- PeopleGoal
For employee performance tracking


KPI Software Selection Criteria
When selecting the best KPI software to include in this list, I considered common buyer needs and pain points like tracking real-time performance metrics and customizing dashboards for different teams. I also used the following framework to keep my evaluation structured and fair:
Core Functionality (25% of total score)
To be considered for inclusion in this list, each solution had to fulfill these common use cases:
- Track and display key performance indicators
- Visualize data with charts and graphs
- Availability of API for connecting data sources
- Import data from multiple sources
- Export reports for sharing
Additional Standout Features (25% of total score)
To help further narrow down the competition, I also looked for unique features, such as:
- AI-driven insights and recommendations
- Customizable KPI alerting
- Natural language query support
- Mobile-optimized dashboards
- Embedded analytics for external sharing
Usability (10% of total score)
To get a sense of the usability of each system, I considered the following:
- Simple and intuitive dashboard navigation
- Clean and user-friendly interface design
- Minimal clicks to access core features
- Responsive performance with large datasets
- Accessibility for users with different skill levels
Onboarding (10% of total score)
To evaluate the onboarding experience for each platform, I considered the following:
- Availability of step-by-step product tours
- Access to training videos and documentation
- Pre-built dashboard and KPI templates
- In-app chatbots for onboarding support
- Live or recorded onboarding webinars
Customer Support (10% of total score)
To assess each software provider’s customer support services, I considered the following:
- Multiple support channels, including chat and email
- Fast response times to inquiries
- Access to a searchable knowledge base
- Availability of dedicated account managers
- Community forums for peer support
Value For Money (10% of total score)
To evaluate the value for money of each platform, I considered the following:
- Transparent and flexible pricing plans
- Features included at each pricing tier
- Free trial or demo availability
- No hidden fees or surprise charges
- Discounts for annual or volume commitments
Customer Reviews (10% of total score)
To get a sense of overall customer satisfaction, I considered the following when reading customer reviews:
- Positive feedback on KPI tracking accuracy
- Reports of reliable uptime and performance
- Comments on ease of customization
- User satisfaction with customer support
- Feedback on integration capabilities
How to Choose KPI Software
It’s easy to get bogged down in long feature lists and complex pricing structures. To help you stay focused as you work through your unique software selection process, here’s a checklist of factors to keep in mind:
| Factor | What to Consider |
| Scalability | Will the software handle your data volume and user growth over time? Check for user limits, data caps, and upgrade paths. |
| Integrations | Does it connect natively to your HRIS, payroll, CRM, or analytics tools? Confirm compatibility with your existing tech stack. |
| Customizability | Can you tailor dashboards, KPIs, and reports to your organization’s needs? Watch for rigid templates or limited editing options. |
| Ease of use | Will your team adopt it quickly? Look for intuitive navigation, clear labeling, and minimal training requirements. |
| Implementation and onboarding | How long will setup take, and what resources are needed? Ask about migration support, onboarding help, and typical go-live timelines. |
| Cost | Are pricing tiers transparent and predictable? Factor in user licenses, add-ons, and potential overage fees. Compare total cost of ownership. |
| Security safeguards | Does the tool meet your organization’s data privacy and security standards? Look for encryption, access controls, and compliance certifications. |
| Support availability | What support channels are offered, and during what hours? Consider if you need 24/7 help, dedicated account reps, or self-service resources. |
What is KPI Software?
KPI software is a digital tool that helps organizations use KPIs to track, visualize, and analyze key performance indicators in real time. These cloud-based platforms centralize data from multiple sources, allowing teams to monitor business KPIs, progress toward goals, identify trends, and make better decisions. KPI software is used by HR professionals, managers, and business leaders to ensure alignment with strategic objectives and to support data-driven performance management.
Features
When selecting KPI Software, keep an eye out for the following key features:
- Custom dashboard creation: Build and personalize dashboards to display the most relevant KPIs for different teams or roles, making it easy to focus on what matters most.
- Data source integration: Connect to various data sources such as spreadsheets, databases, and cloud applications to automatically pull in up-to-date information for KPI tracking.
- Real-time data updates: View the latest performance metrics as data changes, ensuring informed decisions.
- Role-based access controls: Set permissions so users only see the KPIs and data relevant to their responsibilities, supporting data privacy and clarity.
- Automated reporting: Schedule and distribute KPI reports to stakeholders at regular intervals, reducing manual effort and keeping everyone informed.
- Goal and target setting: Define specific KPI targets and track progress toward them, helping teams stay aligned with organizational objectives.
- Drill-down capabilities: Click into KPIs to explore underlying data and uncover the factors driving performance, supporting deeper analysis.
- Historical trend analysis: Review past KPI data to identify patterns, seasonality, or long-term changes, aiding in forecasting and strategic planning.
- Mobile accessibility: Access dashboards and reports from mobile devices, allowing users to monitor KPIs on the go.
- Export and sharing options: Easily export dashboards or reports in various formats and share them with colleagues or external partners as needed.
CommonKPI Software AI Features
Beyond the standard KPI Software features listed above, many of these solutions are incorporating AI with features like:
- Automated anomaly detection: AI algorithms scan KPI data to identify unusual patterns or outliers, alerting users to potential issues or unexpected changes without manual monitoring.
- Predictive analytics: AI models analyze historical KPI trends to forecast future performance, helping teams anticipate challenges and opportunities before they arise.
- Natural language queries: Users can ask questions about their KPIs in plain language, and the AI interprets and returns relevant data or visualizations, making insights more accessible.
- Automated insight generation: The software uses AI to surface key findings, correlations, or drivers behind KPI changes, reducing the need for manual data exploration.
- Smart alerting: AI prioritizes and customizes alerts based on the significance and context of KPI changes, ensuring users are notified only when action is truly needed.
Benefits
Implementing KPI software provides several benefits for your team and your business. Here are a few you can look forward to:
- Centralized performance tracking: Monitor all your key metrics in one place by integrating data from multiple sources and visualizing them on custom dashboards.
- Faster, data-driven decisions: Access real-time KPI updates and automated reports, enabling your team to respond quickly to changing business conditions.
- Improved goal alignment: Set, track, and communicate KPI targets across teams, ensuring everyone is working toward shared organizational objectives.
- Enhanced accountability: Assign role-based access and track progress against targets, making it clear who is responsible for each KPI.
- Deeper performance insights: Use drill-down analysis, historical trend reviews, and AI-powered insights to uncover the root causes behind KPI changes.
- Proactive issue detection: Benefit from automated anomaly detection and smart alerts that notify you of potential problems before they escalate.
- Greater transparency and collaboration: Share dashboards and reports easily, keeping stakeholders informed and supporting a culture of openness around performance data.
Costs and Pricing
Selecting KPI software requires an understanding of the various pricing models and plans available. Costs vary based on features, team size, add-ons, and more. The table below summarizes common plans, their average prices, and typical features included in KPI software solutions:
Plan Comparison Table for KPI Software
| Plan Type | Average Price | Common Features |
| Free Plan | $0 | Basic dashboard creation, limited data integrations, standard reporting, and community support. |
| Personal Plan | $5-$25/user/month | Custom dashboards, more data sources, basic alerts, export options, and email support. |
| Business Plan | $25-$60/user/month | Advanced integrations, team collaboration tools, role-based access, scheduled reports, and chat support. |
| Enterprise Plan | $60-$120/ user/month | Unlimited users, custom onboarding, advanced security, dedicated account management, and SLA-backed support. |
KPI Software FAQs
Here are some answers to common questions about KPI software:
How do I know if my organization needs KPI software?
If you’re struggling to track performance metrics across teams, relying on manual spreadsheets, or missing timely insights, KPI software can help streamline data and automate reporting. It’s especially useful as your organization grows and requires better reporting tools as your data sources multiply.
Can KPI software integrate with my existing HR and business systems?
Yes, most KPI software solutions offer integrations with HRIS, payroll, CRM, and other business tools. Always confirm compatibility with your current systems and check if integrations are native or require third-party connectors.
What should I look for when evaluating KPI software vendors?
Focus on scalability, integration options, customizability, ease of use, and security safeguards. Ask about onboarding support, customer service availability, and whether the pricing model fits your budget and growth plans.
How long does it take to implement KPI software?
Implementation timelines vary. Some tools can be set up in a few hours with pre-built templates, while others may require weeks for data migration, integration, and training. Ask vendors for typical onboarding timelines and available support resources.
Is my data secure in the KPI software platforms?
Most reputable KPI software providers use encryption, access controls, and compliance certifications to protect your data. Always review each vendor’s security documentation and ask about their approach to privacy and regulatory compliance.
What’s Next:
If you're in the process of researching KPI software, connect with a SoftwareSelect advisor for free recommendations.
You fill out a form and have a quick chat where they get into the specifics of your needs. Then you'll get a shortlist of software to review. They'll even support you through the entire buying process, including price negotiations.