Recruitment Dashboard: What It Is And How To Create One


In this age of data, recruitment dashboards are useful for providing insights to help fine-tune the recruitment process and reward and develop recruitment teams.
Here I cover benefits, key metrics, and best practices and provide some examples of recruitment dashboards out in the wild.
Let’s dive in.
What Is A Recruitment Dashboard?
A recruitment dashboard is a visual reporting tool within your recruitment platform that displays key metrics and data related to the recruitment process. It provides HR professionals, recruiters, and hiring managers with real-time insights into areas such candidate quality, recruitment marketing, and process efficiency.
The dashboard aims to present key recruitment metrics in an easily digestible format—often using charts, graphs, and tables—allowing stakeholders to analyze and report on various recruiting metrics effectively.
Recruitment Dashboard Benefits
A recruitment dashboard gives organizations comprehensive insights into their hiring processes to make data-driven recruitment decisions, perform recruitment audits, and ultimately attract and retain top talent more effectively.
Key benefits include:
1. Enhanced data visibility and accessibility
- Real-time data access: Recruitment dashboards provide real-time data, allowing HR professionals and hiring managers to access the latest information instantly.
- Centralized information: All relevant recruitment metrics are displayed in one place, reducing the need to navigate multiple systems or reports.
- Integrated data: A recruitment dashboard can be paired with free recruiting tools and more to monitor key hiring metrics and optimize decision-making.
2. Data-driven decision making
- Informed strategy development: By analyzing data from the dashboard, organizations can make informed decisions about where to allocate resources, which channels to focus on, and how to improve recruitment strategies.
- Identifying trends and patterns: Dashboards help in spotting trends over time, such as seasonal application spikes or successful hiring channels, enabling better planning and forecasting.
3. Efficiency and process improvement
- Bottleneck identification: Dashboards help to highlight delays or inefficiencies in the recruitment process, such as long interview cycles or slow response times, and address them promptly.
- Streamlined processes: By visualizing the entire recruitment funnel, organizations can streamline processes, reduce time-to-hire, and improve overall efficiency.
4. Performance tracking and accountability
- Recruiter performance metrics: Monitor the performance of individual recruiters, including the number of hires made, time taken to fill positions, and candidate feedback scores.
- Goal setting and achievement: Track progress toward recruitment goals, such as reducing time-to-fill or increasing diversity, and make adjustments as needed.
5. Improved candidate experience
- Enhanced communication: Track candidate communication and engagement metrics to ensure timely follow-ups and a positive experience.
- Feedback integration: Use candidate feedback to identify areas for improvement in the recruitment process and enhance the candidate experience.
6. Cost management and optimization
- Cost tracking: Monitor costs associated with different recruitment activities, such as job advertising, agency fees, and referral bonuses.
- ROI analysis: Evaluate the return on investment (ROI) for various recruitment channels and campaigns, allowing for better budget allocation and cost optimization.
7. Diversity and inclusion monitoring
- Diversity metrics: Track the diversity of applicants and hires, helping organizations to assess and improve their diversity and inclusion initiatives.
- Bias detection: Identify potential biases in the recruitment process, such as disparities in the advancement of candidates from different demographic groups.
8. Strategic workforce planning
- Talent pipeline visualization: View the status of the talent pipeline, including potential future hires and the readiness of candidates, to ensure a continuous supply of talent.
- Resource allocation: Optimize the allocation of resources, such as recruiters and budget, based on the demand for different positions and departments.

9. Enhanced collaboration and communication
- Unified HR reporting tool: Provide a single source of truth for all stakeholders, including HR, hiring managers, and executives, facilitating better collaboration and communication.
- Customizable views: It’s possible to customize dashboard views for different audiences, ensuring that each stakeholder has access to the most relevant information.
10. Compliance and reporting
- Regulatory compliance: Track and report on metrics related to compliance with employment laws and regulations, such as equal employment opportunity (EEO) requirements.
- Audit readiness: Maintain an accurate and up-to-date record of recruitment activities, making it easier to respond to audits and inquiries.
Which Metrics Should You Track On Your Recruitment Dashboard?
The recruitment metrics you choose to track on the dashboard will depend on the maturity and complexity of your hiring process, but here’s what’s possible:
1. Application metrics
- Number of applications: The total number of applications received for each job opening.
- Application sources: Breakdown of where applications are coming from, such as job boards, social media, referrals, etc.
2. Candidate pipeline metrics
- Candidates by stage: Number of candidates at each stage of the hiring process (e.g., application, screening, interview, offer, hired).
- Conversion rates: The percentage of candidates moving from one stage to the next (e.g., screening to interview).
3. Time metrics
- Time to Fill: Average time taken to fill a position, from posting the job to the candidate's acceptance.
- Time to Hire: The time from when a candidate first enters the pipeline until they accept the job offer.
- Time in each stage: Average duration candidates spend at each stage of the recruitment process.
4. Cost metrics
- Cost per hire (CPH): Total recruitment costs divided by the number of hires.
- Cost per application (CPA): Total recruitment marketing spend divided by the number of applications received.
- Recruitment advertising spend: Breakdown of spending on various advertising channels.
5. Source metrics
- Source of hire: The percentage of hires coming from each recruitment source.
- Source quality: Performance and retention rates of hires from different sources.
6. Candidate experience metrics
- Candidate satisfaction score: Feedback from candidates regarding their experience during the recruitment process.
- Candidate net promoter score (cNPS): A measure of candidates' willingness to recommend the company to others.
- Application completion rate: The percentage of candidates who start and complete the application process.
7. Diversity and inclusion metrics
- Demographic breakdown: Data on the diversity of applicants and hires (e.g., gender, ethnicity, age).
- Diversity in hiring: The percentage of hires from different demographic groups.
8. Employee referral metrics
- Referral rate: The percentage of hires that come through employee referrals.
- Referral success rate: The conversion rate of referred candidates to hires.
- Referral bonus costs: Total costs associated with referral bonuses.
9. Recruiter performance metrics
- Number of candidates sourced: The number of candidates sourced by each recruiter.
- Number of candidates managed: The number of candidates handled by each recruiter.
- Offers extended and accepted: The number of job offers made and accepted per recruiter.
- Recruiter efficiency: Time taken by recruiters to move candidates through the pipeline.
10. Offer and acceptance metrics
- Offer acceptance rate: The percentage of job offers accepted by candidates.
- Reasons for offer rejection: Common reasons why candidates decline job offers.
11. Retention metrics
- First-year retention rate: The percentage of new hires who remain with the company for at least one year.
- Turnover rate: The rate at which employees leave the company, particularly focusing on new hires.
12. Recruitment funnel metrics
- Top of funnel metrics: The number of candidates entering the recruiting funnel.
- Middle-of-funnel metrics: The number of candidates advancing to interview stages.
- Bottom of funnel metrics: The number of candidates receiving offers and being hired.
13. Compliance metrics
- EEO compliance: Metrics related to compliance with equal employment opportunity regulations.
- Application data completeness: Ensuring that required fields are filled out correctly by all candidates.
Recruitment Dashboard Best Practices
Most applicant tracking systems or other types of recruitment software will come with premade dashboards as standard.
However, it might be you want to create a dashboard that better reflects your needs and processes. You can even use the humble spreadsheet!
Here are some best practices to help you build your own dashboard:
1. Define clear objectives
- Purpose and goals: Establish the primary purpose of the dashboard, such as improving time-to-hire, enhancing candidate experience, or optimizing recruitment costs.
- Key metrics alignment: Ensure that the metrics you track align with your recruitment objectives and business goals.
2. Keep it simple and user-friendly
- Intuitive design: Use a clean, simple layout that is easy to navigate and understand, avoiding clutter and unnecessary complexity.
- Data visualization: Utilize visual elements like charts, graphs, and gauges to make data easily digestible and highlight key insights.
- Consistency: Maintain the consistent use of colors, fonts, and formatting to ensure clarity and professionalism.
3. Focus on relevant metrics
- Prioritize key metrics: Focus on the most critical metrics that directly impact your recruitment objectives. Avoid overwhelming users with too much data.
- Contextual information: Provide context for the metrics displayed, such as industry benchmarks or historical data, to aid in interpretation.
4. Ensure data accuracy and timeliness
- Real-time data: Whenever possible, provide real-time or up-to-date data to enable timely decision-making.
- Data quality: Regularly audit the data sources and inputs to ensure accuracy, consistency, and completeness.
5. Customization and personalization
- Tailored views: Allow users to customize their dashboard views based on their roles or specific needs. For example, recruiters may need different metrics than hiring managers.
- Filter and drill-down options: Include filters and the ability to drill down into data for more detailed analysis and to explore specific areas of interest.
6. Use benchmarking and comparisons
- Internal benchmarks: Compare current performance against internal benchmarks or historical data to track progress over time.
- Industry benchmarks: Use industry standards or benchmarks to provide a broader context for evaluating performance.
7. Regular updates and reviews
- Periodic review: Regularly review the metrics and dashboard layout to ensure they remain relevant and aligned with evolving business goals.
- Feedback loop: Solicit feedback from users to identify areas for improvement and ensure the dashboard meets their needs.
8. Ensure data security and privacy
- Access control: Implement appropriate access controls to protect sensitive data and ensure that users only see information relevant to their roles.
- Compliance: Ensure the dashboard complies with data privacy regulations, such as GDPR or CCPA, and company policies.
9. Integrate with other systems
- System Integration: Try to integrate the dashboard with other HR systems, such as human resource management systems, for seamless data flow and comprehensive reporting.
- Automation: Automate data collection and reporting processes to minimize manual effort and reduce the risk of errors.
10. Focus on actionable insights
- Actionable metrics: Choose metrics that provide actionable insights and can guide decision-making or highlight areas for intervention.
- Trend analysis: Include trend analysis to help identify patterns and predict future outcomes, allowing for proactive adjustments.
5 Recruitment Dashboard Examples
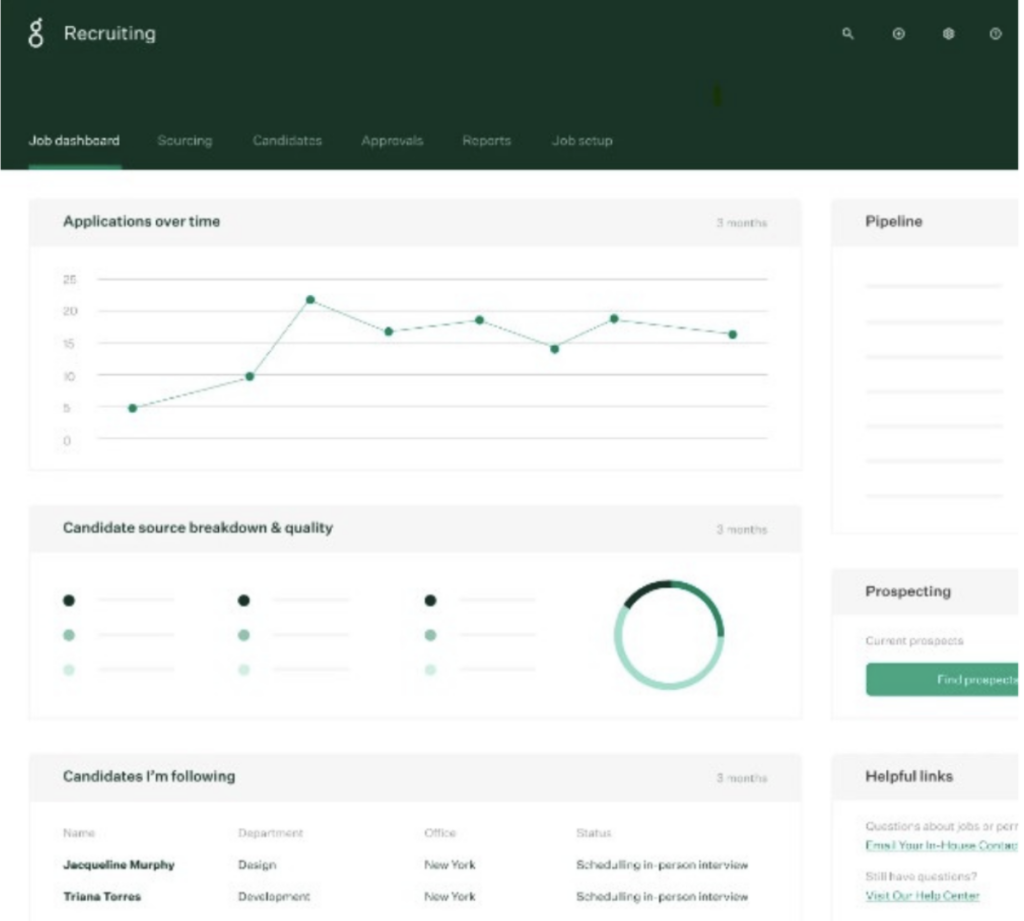
1. Greenhouse

Greenhouse offers and hiring dashboard is easily customizable to display insights into key recruiting metrics like offer acceptance rate and Time to Hire over a given period and by department and recruiter.
2. Workable
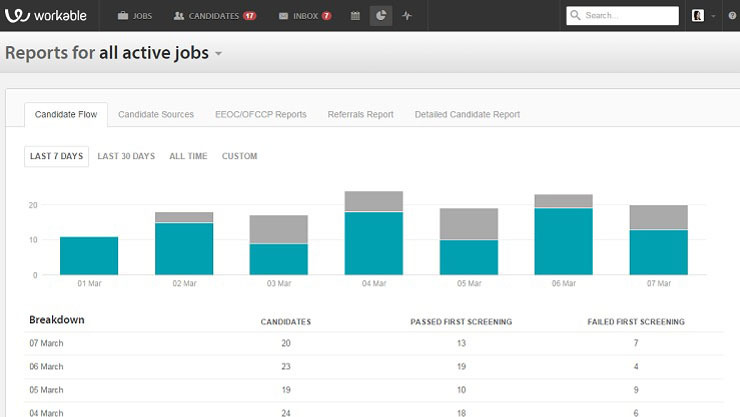
This dashboard in Workable neatly demonstrates the flow of candidates over a given period.
3. Pinpoint
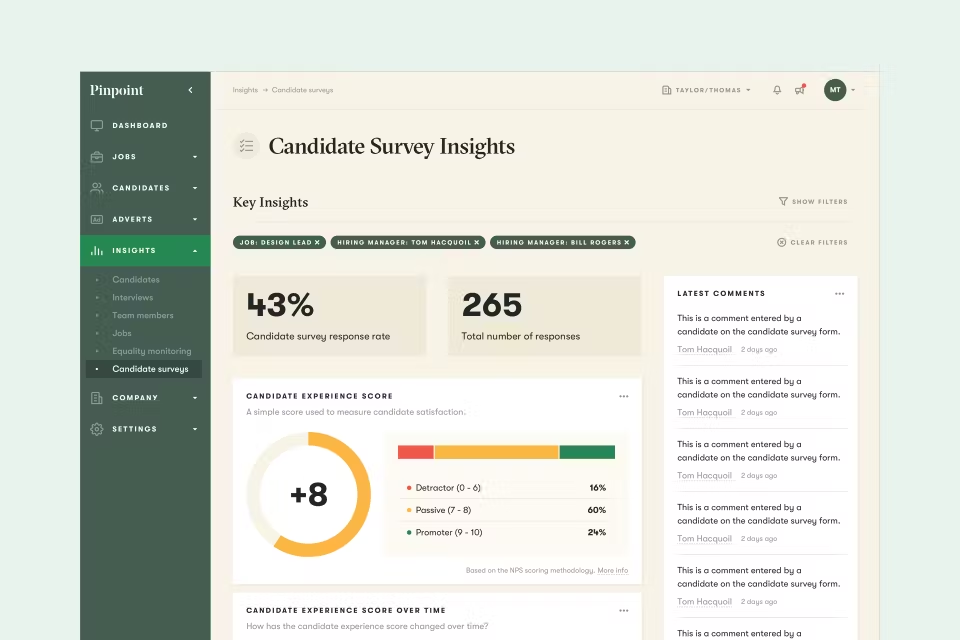
This dashboard in Pinpoint makes it easy to interpret candidate feedback.
4. Rippling
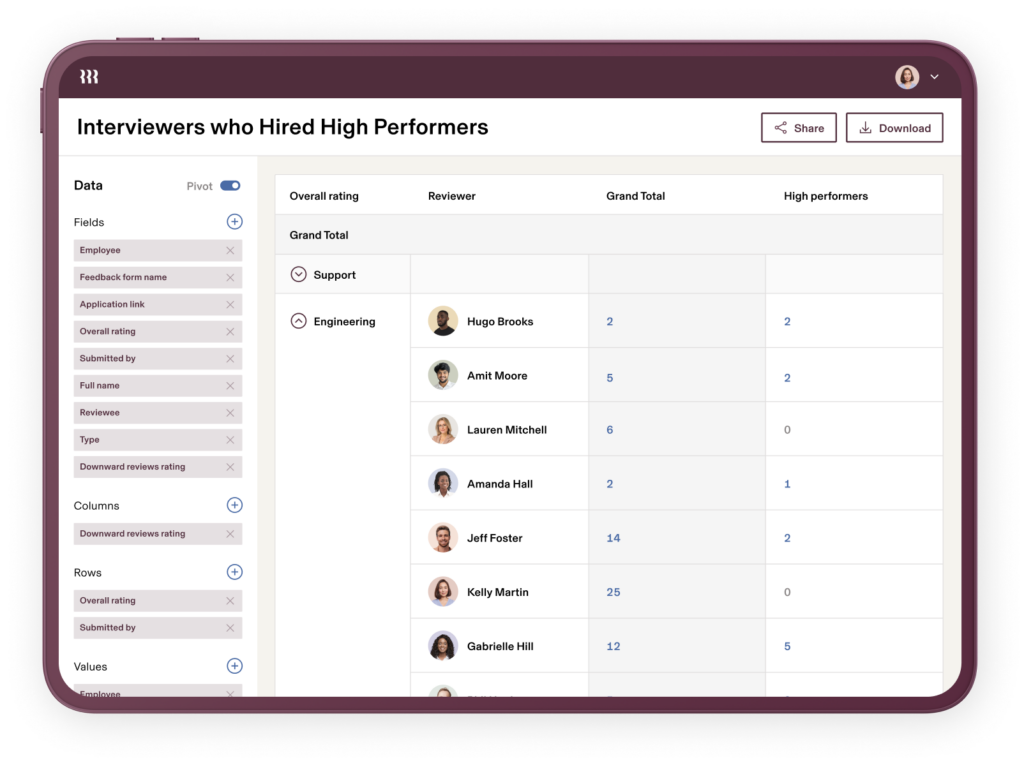
This dashboard from Rippling helps assess recruiters by showing who’s recruited the most high-peformers.
5. Geckoboard
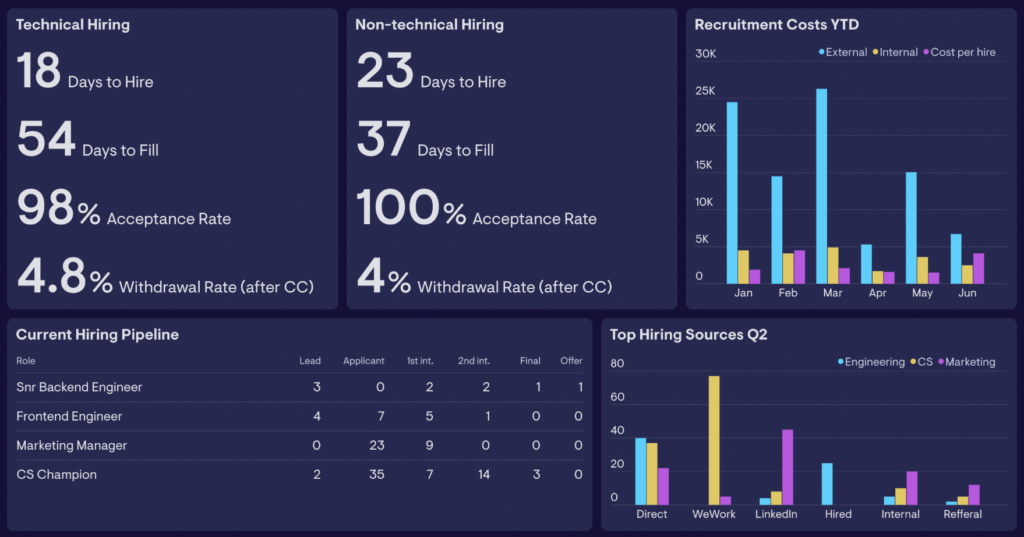
Geckoboard’s high-level dashboard makes it easy to compare high-level key recruitment metrics for different departments and teams.
