Organizational Health Metrics: Examples + Complete Guide

Organizational health metrics are clear, data-driven indicators that show how well your company’s culture, values, and employee engagement are thriving. By tracking these metrics, you can quickly spot strengths and problems, so you know exactly where to focus your efforts for a healthier, more productive workplace. If you want to understand what’s really going on inside your organization, these numbers are your go-to “vital signs.”
What Are Organizational Health Metrics?
The phrase organizational health metrics sounds very HR-y, doesn’t it? Well, in a way, it is. But that doesn’t mean it’s not important and leaders (yes, even leaders outside of HR) shouldn’t focus on it.
I personally love a good analogy so why not start with one?
When you go to the doctor, there are a number of personal data points that he/she takes to measure the overall health of the individual; heart rate, BMI, temperature, blood pressure, etc. These data points tell the doctor a story of what is happening inside your body.
Think of organizational health metrics (OHM) kind of the same way, but for companies.
Organizational health metrics are simply data that one tracks to measure how healthy your company culture is.
When done well, these metrics can also measure how well you live up to your company values. In an age where culture is king and an increasingly high number of individuals are aligning their personal values to what organizations they join, knowing how healthy your culture is can be critical.
Examples Of Metrics
Not every company is going to have the same OHMs. Every company culture is different and, as a result, every company’s OHMs are different. There are an infinite number of ways you can slice and dice data to help be your guiding light.
Let’s look at a few common metrics:
Turnover
Turnover is an extremely common metric. Turnover tells you the percentage of people that start working for your company and leave. It’s beneficial because exit rates are typically a #1 indicator for company health. Imagine going to the best party ever, with the best people, where you felt the most alive. You wouldn’t want to leave, right?
On the flip side, if you attended a party where you felt unwelcomed, unwanted and the party was terrible, you would probably look for the exit as soon as possible.
The same goes for companies. Companies that throw a “good party” make people want to stay and be their best. This is why we measure turnover; to see how many people and how quickly they run towards the door.
Turnover can be calculated in a multitude of ways. The most common way is this:
Turnover = number of employees who departed / average number of team members. Then convert to a percentage.
Some notes on turnover calculations:
- You can run this equation for any period you’d like. Two popular options are Year to Date, or YTD turnover (turnover only measured since Jan. 1) and Rolling Turnover (turnover that is measured on a rolling 12 month basis)
- Regardless of the timeframe you measure, just make sure your numerator and denominator are looking at the same timeframe.
- You can use this equation for the entire company, a specific department or location or even just a position.
- The higher the percentage, the higher the turnover. Meaning people are leaving your company more.
- Some companies measure regrettable turnover and non-regrettable turnover. Regrettable turnover would be an individual who left the organization and it was a loss for the company. Non-regrettable turnover would be an individual who was let go for performance reasons.
- Turnover can also be categorized into voluntary and involuntary. Voluntary turnover refers to employees who left the company on their own accord. Involuntary turnover means the person was forced to leave due to conduct, reduction in force, job elimination or performance issues
- Turnover percentage can exceed 100%
This is an extremely helpful metric and fairly standard. A quick google search will allow you to compare your turnover to other companies in the same industry and glean industry averages for comparison.
Ebook: Why People Quit and How to Retain Your Top Talent

Turnover, 90 day
90 day turnover is another standard metric used by many companies. The mechanics work very similar to ‘turnover’, but it specifically measures people who leave in the first 90 days (or any other time period you want to measure under 1 year).
The reason this measure is so popular is because it is an indicator of how well you do in selecting, welcoming and onboarding talent.
This metric tends to be a higher percentage than regular turnover by comparison.
Engagement Score
Unlike turnover rates, there isn’t a common equation for how engagement scores are calculated. It varies from company to company. Though not adopted by all, the most common that I’ve seen is via an employee engagement survey.
The goal of having an “engagement score” is to assess the employee population’s happiness and furthermore, to assess the likelihood of population turnover risk.
As stated above, calculations vary company to company but most engagement scores are produced via a survey sent to (in most cases) the entire employee population.
This calculation or score is derived out of one to six unique questions or agreements with a statement and then averaged to populate an engagement index.
These questions may range from, “how likely are you to recommend [INSERT COMPANY] to a friend” to “I am proud to work for [INSERT COMPANY].”
The good thing about an engagement score is you have the freedom to design it how you want. You can calculate any number of metrics to measure your company’s unique engagement rating.
The downside is that when comparing your engagement scores to external parties, it’s most likely not going to be apples to apples. With that being said, there are many resources and surveys that benchmark industry average engagement scores.
Internal Promotion Score
This metric helps you understand the number of positions you’re filling with already existing talent.
This is calculated as follows:
Internal Promotion Score = number of internal talent that has taken new roles / # of open positions you had.
Your organization needs to determine what is the right number for you. Some organizations have practices where they only promote from within, while others seek to find a 50/50 split.
When trying to figure out what your goal is, keep in mind the balance of skills. At times, you will have all the skills and capabilities needed to meet your goals while other times you may have to go to market to find said skills.
New Hire Success Rate
Attracting, hiring, welcoming and allowing new, great talent to thrive is much more difficult than it sounds.
While difficult, it’s also a sign of how healthy an organization is. Think about the party analogy. A great party welcomes newcomers and allows them to thrive in the environment. Same applies here.
New Hire Success Rate is another metric that isn’t standard across the board so companies have the ability to design it how they see fit. There are a variety of things to take into account when looking at new hire success rate:
· 90-day turnover
· 1 year turnover
· Qualitative assessments of the individual’s assimilation and performance
· First performance review rating of the individual
· First leadership score from engagement surveys
Similar to engagement, you can use any number of these metrics to determine the ‘new hire success rate’ metric. Keep in mind that this can be contextual at times. Not all new hire experiences are created the same and some individuals walk into a bigger mess than others.
Which OHMs Should I Use?
As I said before, all company cultures are different, which means different metrics will be indicators for the success of your organization’s health.
The compass to finding the starting point of OHMs can be found by utilizing the chart below. Spoiler alert- it’s all about values.
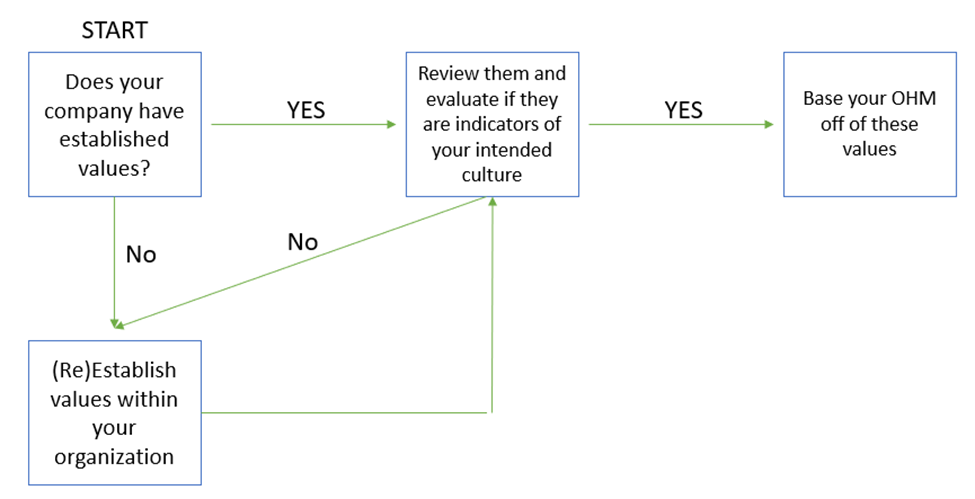
Culture is (or should be) a result of how well you live up to your values.
For example, if one of your company values is “integrity,” it would be safe to say that doing what’s right, accuracy in reporting and standing up for what is fair and just would be hallmarks of the culture.
To successfully measure, you would need to look at your company and determine when and where that could be quantified.
Do you want a culture where people thrive and can be their best selves? Then maybe regrettable turnover, engagement scores and the percentage of individuals who participate in developmental activities are the right ones for you.
Understanding Culture: Realism Vs. Aspirational
Of course, every company is going to have aspects of their culture that they don’t like. No one person is perfect and neither are companies.
When talking about culture, company leaders need to find the right balance between what is, what will be and what should be. This trichotomy is probably the most difficult part of the culture formation because it requires a balance of many parts - taking the best parts of the culture and preserving it, seeing what’s to come and then, ultimately, forming the culture into what you want it to be.
When thinking about the culture you have, it’s equally important to think about the culture you aspire to be. Balance the parts of your culture that make you unique and propel your business, while also implementing aspects you want to grow into.
Benefits Of Measuring And Utilizing Organizational Health Metrics
Culture eats strategy for breakfast.
Peter drucker
If we believe that people are the fundamental driver of an organization, why wouldn’t we want to measure how effective our culture is?
When we measure organizational health successfully, it allows us to target what we do well, what we need to improve on, and what our people are feeling.
Just like the doctor example where those metrics she/he measures allow the doctor to determine if you’re sick, where they need to focus and how to make it better. The same applies here.
Studies have shown that while short term success is possible in a toxic culture, long term success isn’t. If companies want to be successful in the long run then fostering a thriving culture is one of the most strategic activities a CEO or leader can do.
There are a few major benefits to promoting and measuring culture. If we want a positive culture, we have to start by measuring it. Below are some benefits to positive organizational health.
1. Positive cultures help people be better and more productive at work and at home. And who doesn’t want happier people in the world?
2. Collaboration increases in a positive workplace.
3. While the statistics may differ from study to study, it’s a well-known idea that stronger cultures drive more revenue.
Gostick and Elton, two leadership experts and authors of “All In” quote a 3X variable to operating profit when there is an engaged team.
Culture And Performance
At times, people misinterpret what it means for an organization to be “healthy.” For an organization or culture to be healthy, there needs to be two key factors.
In business, there needs to be a foundation within the culture that everyone wants to win. The other foundational premise for culture is that performance matters.
This is where it gets tricky.
The reality is that every company has people who don’t perform to the standard expected. In a culture where performance matters, this needs to be addressed and this is where companies need to balance leadership, performance, expectations and capabilities.
A strong culture supports people, gives them the tools needed to do their job and provides opportunity.
A strong culture also knows how to address performance of all levels and doesn’t shy away from managing low performers.
Finding the “goldilocks” zone of support and performance management is complicated, but that’s another article for another day. The point is that you can’t have a positive, healthy organization if poor performance is left unchecked.
Implementation
Implementing OHMs is going to take time. However, the saying “don’t let perfection be the enemy of progress” comes to mind here. If you want to start small and say your organizational health is measured by voluntary turnover because that’s the only metric you have, that’s okay.
I would recommend that you evolve past that if you want a true indication of how healthy your company is, but we all need to start someplace.
When starting on this journey, don’t be overwhelmed by how complex this can get. The fact that you’ve sat down to look at the health of the organization and are trying to find a way to quantify it indicates that you care. That’s the first step. If there isn’t an authentic desire to measure and understand your culture, all the metrics in the world won’t change it.
Some other tips to consider in implementation:
· You’re not alone. There are plenty of resources that exist to get you started, such as various types of business management software or employee engagement tools, to help with tracking your data.
· If you’re in HR and working on this- don’t do it in a silo. Gather employees from multiple levels, multiple departments and make sure the groups are diverse in every way diversity can represent itself, from race to age, gender, sexual orientation, people with disabilities, etc.
· Find ways to continually socialize this with your employee population.
· It’s a marathon, not a sprint.
Conclusion
Overall, while there are plenty of best practices and current ways of measuring organizational health, your company should feel free to measure it how you see fit. There isn’t a one size fits all.
That’s the glory of it. Could you imagine if public company CFOs all started calculating EBITDA differently? Thankfully, we don’t have to play by those same rules.
Every company’s culture is unique, so it would make sense that how they measure the effectiveness of their culture is unique as well.
Pro Tip: If you’re struggling to figure out your company’s OHMs- sit down with frontline employees and ask them. Chances are they have a few thoughts.

