7 Key HR Dashboards & People Analytics Metrics to Track

In today's data-driven world, organizations recognize the immense value of people analytics in making informed decisions and driving positive outcomes.
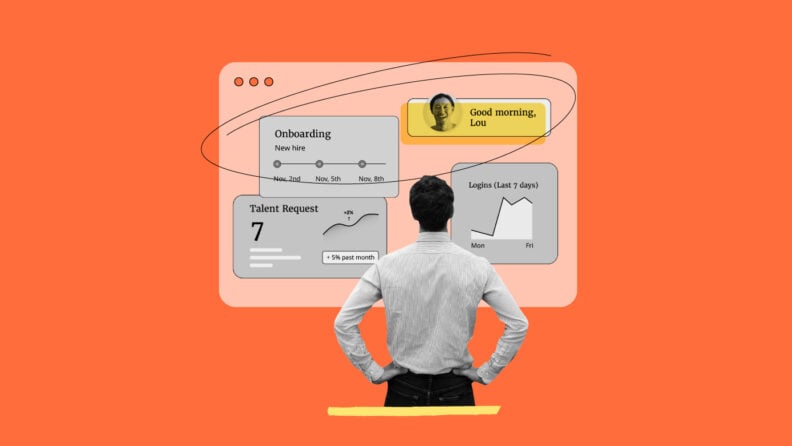
To effectively harness the power of data, it’s crucial to have intuitive and impactful HR dashboards that transform complex insights into actionable visualizations.
The Power of HR Dashboards
Dashboards revolutionize the way HR data is shared and communicated within organizations.
With a focus on accessibility and user-friendliness, HR dashboards enable users at all levels (regardless of their analytical expertise) to easily comprehend and derive value from the data.
HR dashboards employ a variety of data visualizations, including charts, tables, and text tiles, presenting information in a visually appealing and digestible format.
This empowers decision-makers to quickly grasp insights, identify trends, and take proactive actions to identify areas of concern or opportunity — and drive strategic initiatives.
HR dashboards serve as the window into the world of people analytics, enabling organizations to unlock the full potential of their workforce data and drive meaningful business outcomes.
What Can You Do With HR Dashboards?
There are nearly infinite possibilities to create and customize HR dashboards to suit your people analytics needs, but here are just a few ideas I’ve found helpful:
- Create multiple custom dashboards to tell your story visually.
- Use different visualization types — i.e., charts, values, tables, or scatterplots.
- Choose your focus — explore one or many metrics, dimensions, and pivoted dimensions.
- Create options to drill down to underlying data for further explanation and deeper analysis. To streamline this process, consider integrating a robust HR software solution that complements your dashboard capabilities.
- Design the layout of your dashboard with your different audiences in mind.
- Organize, categorize, and group all of your dashboards into a library.
- See the people in your organization matched with their data.
- Use One AI’s embedded insights for forecasting and correlations.
- Use role-based security (RBS) to control user permissions. (Admins can select what their users see and do in the dashboard.)
- Share dashboards with other users or export to PowerPoint to include in presentations.
- Integrate with payroll to view total payroll expenses, overtime hours and costs, and/or tax deductions and benefits contributions.
7 Key HR Dashboards for Comprehensive People Analytics (+ Which Metrics You Should Be Tracking)
To effectively analyze critical aspects of your employee lifecycle, there are seven essential dashboards you should prioritize. Within each of these dashboards, I’ve highlighted some key metrics you should be tracking:
1. Headcount Metrics Dashboard
This dashboard provides a comprehensive view of headcount-related metrics, including total headcount, departmental distribution, workforce demographics, and headcount changes over time. It offers valuable insights into workforce composition, facilitating strategic workforce planning and resource allocation.

Key Metric to Track: Headcount Growth Rate
Headcount growth rate measures the percentage increase in the number of employees hired by a manager. It indicates the manager's effectiveness in attracting and retaining top talent while building their team. Understanding the drivers behind headcount growth, such as increased sales or workload distribution, helps identify areas for improvement and strategic planning.
Related read: Best Workforce Analytics Software
2. Span of Control Dashboard
The span of control dashboard focuses on managerial hierarchies and provides visibility into the distribution of direct reports per manager. It enables organizations to optimize team structures, identify potential bottlenecks, and ensure effective leadership and supervision across the organization.
Key Metrics to Track
Span of control rate measures the number of employees directly reporting to a manager, providing insights into the distribution of workload. By tracking this metric, organizations can identify managers with an excessively large or small span of control, allowing for adjustments to optimize team performance.
Number of Managers with 1-2 Direct Reports: Identifying which managers have one or two direct reports provides insights into the distribution of managerial responsibilities and the effectiveness of team structures. When there is a significant number of managers with only one or two direct reports, it may indicate an inefficient use of managerial resources and a lack of proper delegation.
3. Employee Turnover Dashboard (Attrition Dashboard)
Understanding employee turnover is vital for organizations seeking to improve retention and reduce costly talent churn. This dashboard highlights attrition rates, reasons for departure, voluntary vs. involuntary turnover, and associated costs. It helps pinpoint areas of concern and supports the development of targeted retention strategies.
Key Metric to Track: Termination Rate Volume
Termination rate volume measures the number of employees leaving the organization within a specific period so the company can identify patterns in employee turnover under different managers. This insight allows proactive steps to address any underlying issues causing high turnover rates.
4. Talent Flow Dashboard
The talent flow dashboard visualizes the movement of employees within the organization, tracking internal transfers, promotions, and lateral movements. It enables HR leaders to identify high-potential individuals, uncover patterns of career progression, and ensure effective talent mobility across teams and departments.
Key Metrics to Track
Repeat Low Performers: Tracking repeat low performers highlights employees who consistently fail to meet goals and expectations. This metric evaluates a manager's effectiveness in developing their team members and providing necessary skills for success. It also helps assess goal-setting processes and identify opportunities for improvement.
High-Performer Termination Rate: This metric examines the attrition of top-performing employees. It reveals which managers are losing valuable talent and helps uncover underlying reasons for attrition. Identifying effective leaders who retain high performers enables sharing best practices and fostering talent retention across the organization.
5. Career Growth / Promotions Dashboard
This dashboard focuses on career progression within the organization, highlighting employee promotions, career growth opportunities, and advancement rates. It enables HR professionals to identify talent with potential for growth, design effective career development programs, and foster a culture of continuous advancement.
Key Metric to Track: Promotion Rate
Promotion rate tracks the number of employees promoted across the organization. It highlights managers excelling in growing talent, allowing organizations to monitor manager effectiveness, identify potential areas of improvement, and support succession planning.
6. Diversity (DE&I) Dashboard
Promoting diversity, equity, and inclusion (DE&I) is a priority for many organizations. Some now add a “B” to include Belonging in these types of initiatives. This dashboard provides insights into workforce diversity metrics, such as gender, ethnicity, and representation across different job levels and departments. It helps organizations measure progress, identify gaps, and develop targeted initiatives to foster a more inclusive workplace.
Key Metrics to Track
Female Representation: Tracking this metric helps identify challenges related to gender imbalance and supports initiatives to create a more inclusive workplace.
Salary Ratio By Gender: This metric identifies wage discrepancies, promoting fair and equitable compensation practices. Evaluating manager salary ratios is crucial for ensuring equal pay and fostering a supportive work environment.
Diverse Retention Gap: This metric analyzes the difference in retention rates between diverse and non-diverse employees. It uncovers any issues related to manager diversity and inclusivity, highlighting areas for improvement and creating a more inclusive workplace culture.
In the analytics-driven landscape of HR, integrating employee evaluation feedback, into our dashboards, enhances decision-making
7. Employee Tenure Dashboard
The employee tenure dashboard focuses on analyzing the duration of employees' tenure within the organization. It provides insights into average tenure, turnover patterns based on tenure, and the impact of tenure on performance and engagement. This information guides HR leaders in implementing effective strategies to enhance employee retention and engagement.
Key Metric to Track: Employee Retention Rate
Employee retention rate measures the percentage of employees who remain with the company after being hired by a manager. This metric is important for assessing manager effectiveness because it shows whether or not they are creating an environment that encourages long-term employment and job satisfaction.
If you're not a data person at heart and you need help setting up your analytics software for future success, a short-term consultation with an HR analytics firm may also be a worthwhile next step.
Unlock the Full Potential of Your Workforce Data With HR Dashboards
HR dashboards are indispensable tools for leveraging the full potential of people analytics. One example is One Model's Storyboards, which provide organizations with a powerful tool to communicate analytical insights derived from data.
People analytics dashboards empower organizations to unlock the value of their data by transforming complex insights into visually compelling, easily understandable, and highly customizable formats.
Related reads:
- HR Data Analysis: How to Use Your HR Data Effectively
- Best People Analytics Conferences to Learn from
- Best People Analytics Software for Workforce Analysis
- Best HR Analytics Software for Actionable Workforce Data
- 40 HR Metrics You Should Track and Data Management Best Practices
- Top 15 HR Analytics Certifications
Also see: One Model's people & predictive analytics software
